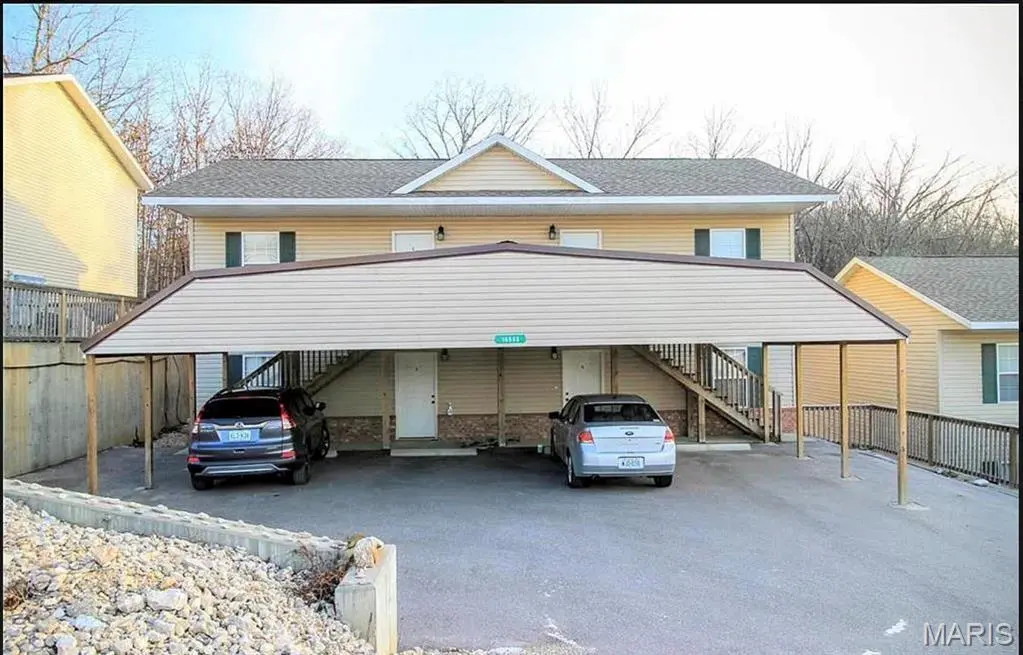
 Fourplex
16565 Hunters Ridge Ln · St. Robert, MO
Flood risk 1/10 · Minimal
- FEMA flood zone
- X (unshaded)
- Chance of flooding over 30 yrs
- 0.0%
- Est. flood insurance / yr
- $507 – $1,088
Fire risk 4/10 · Minor
- Est. fire insurance / yr
- $1,054 – $1,958
Heat risk 4/10 · Minor
- Hot days now (above 106°F)
- 7 days/yr
- Hot days in 30 yrs
- 19 days/yr
Wind risk 2/10 · Minimal
- Chance of severe wind over 30 yrs
- 1.0%
Air-quality risk 1/10 · Minimal
- Unhealthy air days now
- 0 days/yr
- Unhealthy air days in 30 yrs
- 0 days/yr
Risk factors via First Street. Map © Google.
Why this score? — see what drove the C+ grade
The composite is a weighted blend of 9 inputs, each scored 0–100. Each bar is that input's sub-score; the figure is the points it added to the 100-point composite (weight × sub-score).
- Cash flow +24.8/30.0
- DSCR +8.1/10.0
- ARV discount +7.5/15.0
- 1% rule +5.5/10.0
- Rent growth +5.0/5.0
- Schools +4.2/10.0
- Livability +2.5/5.0
- Condition / age +2.5/5.0
- Appreciation +0.0/10.0
$289,900
🖨 Deal sheet 📄 Offer letter ✓ Due diligence
Multi-family units
County records classify this as Multi-Family (5+ Unit). Listing-text estimate: 4 units. estimate disagrees with records
5+ unit building — per-unit beds/baths from public records are typically unavailable; the breakdown below (if shown) is an estimate from the listing text.
Listing remarks MLS
Check out this FOURplex building that is fully rented and ready for a new investor! This building has four, 1 bedroom, 1 bathroom units and is located in the Hunters Ridge Subdivison within the Waynesville School District and close to FLW. All units feature an open concept kitchen/living room with tile flooring and carpet. The bedroom boasts carpet and a large closet. The bathroom is large & has a shower/tub combo and a closet laundry area with stackable washer/dryer. All units are managed by a professional property management company and have been well maintained and consistently rented. Simply continue with the current management company, move in & let property management handle the rest. Rent is currently at $525/unit. Owner is responsible for water & sewer, tenant pays all other utilities. Property is sure to be a great fit to your investment portfolio.
Key facts
- 6,098 sq ft lot
- 4 parking spots
- Built 2011
Property features AI
Finance
- Other: Seller may consider concessions
- Financial info: Gross income reported at $3,400; All units leased (4 of 4)
- HOA & community: 4 units in the community
Exterior
- Parking: Attached carport; 4 carport spaces
- Utilities: Electricity available; Water available
- Home design: Residential income property (2–4 units); Apartment building; Two levels
- Construction: Vinyl siding
- Exterior features: Entry steps/stairs; Exterior lighting; Private entrance; Private yard; Adjoins wooded area; Back yard
Interior
- Kitchen: Cooktop; Dishwasher; Disposal; Exhaust fan; Freezer; Instant hot water; Ice maker; Microwave; Oven
- Bedrooms: No main or upper level bedrooms reported
- Flooring: Hardwood; Linoleum
- Bathrooms: No main or upper level bathrooms reported
- Heating & cooling: Forced air heating; Central air conditioning; Electric water heater
- Interior features: Ceiling fans; Kitchen/dining room combo; Open floor plan
- Laundry & utility: Washer and dryer (stacked); Washer/Dryer included; Dryer; In-bathroom laundry
Neighborhood map
What this means for you Summary
Snapshot
- This is a 4 × 1-bed/1-bath units multifamily listed at $290k.
Deal economics
- At list price, monthly cash flow is $616 ($7k/yr) — positive. Per door: $154/mo.
- The deal already cash-flows at list — no discount required.
- Meets the 1% rule at list price ($3k rent vs $290k).
- Cap rate 8.8% vs local median 4.4% in St. Robert — top-decile yield for the area; either an underpriced asset or a hidden risk that comps aren't pricing in. Stress-test before assuming the spread holds.
Location & tenants
- Location reads: area grade C — affects rentability + tenant quality, not the cash-flow math above.
- Waynesville R-VI (town): math 46% / reading 53% proficiency, ranked #41 of 324 in MO (top 13%) — families likely to look elsewhere, expect single-tenant / working-renter base with shorter leases.
- Zoned schools: Freedom Elem. (math 44% / reading 45%, grade F, #413 of 1,115 statewide, top 42%, 961 students, 54% FRL); Waynesville Sr. High (math 37% / reading 53%, grade D-, #176 of 521 statewide, top 34%, 1,704 students, 39% FRL) — zoned schools average 46% FRL vs 28% district-wide (18 pts higher); higher-poverty schools than district average — tighter screening recommended.
- Market conditions: Rents rising fast (+10.2%/yr); 130 active listings in the ZIP; 7 comparable units currently listed for rent nearby; rentals lingering (median 44d on market — plan ~5-8 weeks vacancy on turnover, expect pricing pressure); 100% of comp listings sitting > 30 days — soft ceiling on asking rent; 62 units permitted in Pulaski County in 2024 (0 in 5+ unit buildings).
- At $3,032/mo this rent would consume 57% of the median local household income ($63k/yr) (locally 368% of renters already pay >50% of income on rent) — very limited rent-growth headroom before tenants either downsize or default.
Forward outlook
- Local home prices are declining (-3.0%/yr); year-one equity from $2k of loan paydown is wiped out by about $9k of value loss. Plan a longer hold.
- At projected returns (-3.0% appreciation + 8.0% rent growth), your $81k cash investment doubles in ~8 years — after that, you're playing with house money.
Negotiation context
- Only 14 days on market — expect competitive offers; lowballing is unlikely to land.
- 4 sale attempts since 7y ago with the ask held roughly flat each time — persistent listings suggest the price (not the market) is what's stuck; bring a comps-based counter.
- Current owner paid $235k; 23% above their basis — modest negotiation headroom, anchor on the comps not their cost.
Questions for the listing agent
- Can we see the unit-by-unit rent roll, current vacancy, and any below-market leases? What's the average tenancy length?
- What capital expenditures (roof, boiler, parking lot, exteriors) have been made in the last 5 years, and what's planned in the next 2?
- Is there a deadline driving the sale (1031 exchange, divorce, estate, relocation)? That informs how much negotiation room exists.
- What's the average days-on-market for RENTAL listings here right now (not sales)? A rising rental-DOM trend means longer vacancies and softer asking-rent achievability than the comps imply.
- What's the recent tenant-quality profile in this submarket — average credit score on applications, eviction rate, late-payment / NSF rate, and stable-employment percentage? A property-management company in the area should have these aggregated.
- How much new apartment / multifamily construction is in the pipeline within 1–3 miles? Heavy new supply (>2% of stock underway) typically softens rents 12–24 months out; light construction supports rent growth.
Investment metrics
- 1% rule
- 1.05% ✓
- Cap rate
- 8.84%
- Cash-on-cash
- 9.11%
- DSCR
- 1.41
- GRM
- 8.0
CMA / ARV
No comps found within radius.
Show comp detail 2 sales within ~0.75 mi
| Address | Dist | Beds/Ba | Sqft | Sold | Price | $/sf | Match |
|---|---|---|---|---|---|---|---|
| 21011 Homer Rd Unit A & B | 0.15mi | 4/4.0 | 2,272 | 5mo | $215,000 | $95 | 76 |
| 20924 Hartsburg Ln | 0.10mi | 6/4.0 | — | 21mo | $265,000 | — | 66 |
Match score weights: distance 35% · size 25% · config 20% · recency 20%. Top-matched comps best support the ARV.
Projected returns pro-forma
-3.0% appreciation · 8.0% rent growth · sell at horizon
- IRR
- 2.5%
- Equity multiple
- 1.10×
- Total profit
- $8,192
- Equity at exit
- $43,225
- IRR
- 16.1%
- Equity multiple
- 2.60×
- Total profit
- $130,214
- Equity at exit
- $25,065
Cash invested: $81,172 (down + closing). Projections, not guarantees.
Landlord ↔ Tenant lean methodology
- Overall (STATE)
- 81 Strongly Landlord-Friendly
- State Missouri
- 81 Strongly Landlord-Friendly · R+10
- County
- — inherits STATE
- City
- — inherits STATE
ZIP-level market 65584
- Home prices YoY
- -18.8%
- Rents YoY
- 10.2%
- Active inventory
- 130
- Price-to-rent
- 31.9×
Monthly cashflow live
- Estimated rent
- $3,032 high interval (Pro) →
- Mortgage (P&I)
- −$1,520
- Tax from tax record
- −$138 /mo · $1,658/yr
- Insurance
- −$121
- HOA
- −$0
- Vacancy / Maint / Mgmt
- −$637
- Net cashflow
- $616
Break-even live
4-unit breakdown (identical units grouped — click to expand)
| Units | Beds | Baths | Est. rent |
|---|---|---|---|
| 4× units | 1 | 1 | $3,032 |
| #1 | 1 | 1 | $758 |
| #2 | 1 | 1 | $758 |
| #3 | 1 | 1 | $758 |
| #4 | 1 | 1 | $758 |
| Total (4 units) | $3,032 | ||
UW: 25.0% down · 7.5% · 30yr · 1.5% tax · 5.0% vac · 8.0% maint · 8.0% mgmt
Financing live
Cash to close
- Down payment
- $72,475
- Closing costs
- $8,697
- Reserves months
- —
- Total cash needed
- —
Loan-product check · same deal, 3 products live
Conventional
25% down · 7.5% · 30yr
- Down + closing
- —
- Monthly P&I
- —
- Monthly cashflow
- —
- DSCR
- —
- Eligible?
- —
Personal DTI + credit; lowest rate.
DSCR
20% down · 8.5% · 30yr
- Down + closing
- —
- Monthly P&I
- —
- Monthly cashflow
- —
- DSCR
- —
- Eligible?
- —
No personal income docs; deal must DSCR.
Hard money
10% down · 12.0% · 12mo
- Down + closing
- —
- Monthly P&I
- —
- Monthly cashflow
- —
- DSCR
- —
- Eligible?
- —
Short-term bridge; refi at stabilization.
Rent comps 7 comps
| Address | Beds | Baths | Sqft | Rent | $/sqft | DOM | Units | Dist |
|---|---|---|---|---|---|---|---|---|
| 20974 Humanity Ln Unit B St Robert, MO | 1.0 | 1.0 | — | $695 | — | 43d | 1 | 0.06mi |
| 20950 Humanity Ln Unit C St Robert, MO | 1.0 | 1.0 | — | $680 | — | 43d | 1 | 0.09mi |
| 20913 Humanity Ln Unit B St Robert, MO | 1.0 | 1.0 | — | $650 | — | 43d | 1 | 0.12mi |
| 20930 Humanity Ln Unit C St Robert, MO | 1.0 | 1.0 | — | $650 | — | 43d | 1 | 0.12mi |
| 16711 Hunters Ridge Ln Unit P St Robert, MO | 1.0 | 1.0 | 600 | $700 | $1.17 | 43d | 1 | 0.19mi |
| 21049 Homer Rd Unit A St Robert, MO | 3.0 | 2.0 | — | $1,125 | — | 43d | 1 | 0.19mi |
| 16324 Heartland Ln Saint Robert, MO | 3.0 | 2.0 | 1571 | $1,825 | $1.16 | 43d | 1 | 0.58mi |
Listing history 10 events
-
2026-06-16status $289,900 Pending 14 DOM
-
2026-06-15days on market $289,900 Active 14 DOM
-
2026-06-14days on market $289,900 Active 12 DOM
-
2026-06-12days on market $289,900 Active 11 DOM
-
2026-06-09days on market $289,900 Active 8 DOM
-
2026-06-08days on market $289,900 Active 7 DOM
-
2026-06-07days on market $289,900 Active 6 DOM
-
2026-06-07days on market $289,900 Active 5 DOM
-
2026-06-01remarks 691-char remark
-
2026-06-01$289,900 Active 1 DOM
ⓘ Source: listings_history table (triggers on properties + properties_extension) + one-shot
backfill from property_details.listing_events for pre-trigger history.
Tax reassessment forecast MO · Resets to sale price
- Current annual tax
- $1,658 · $138/mo
- Projected year-2 tax
- $2,812 · $234/mo
- Expected delta
- +$1,154/yr (+$96/mo · 69.6%)
ⓘ Screening estimate from a state-policy table — verify with the county assessor before closing.
Climate risk First Street
- Flood 1/10 Low FEMA zone X (unshaded) · 0% chance over 30 yrs
- Wildfire 4/10 Moderate
- Heat 4/10 Moderate 7 d/yr ≥106°F today · 19 d/yr by 30 yrs out
- Wind 2/10 Low 100% chance of damaging wind over 30 yrs
- Air quality 1/10 Low 0 unhealthy d/yr today · 0 by 30 yrs out
Nearby sold comps map
Loading sold comps map…
Walkable amenities ~0.75 mi
Loading nearby amenities…
Taxation est. · year 1
- Rental income
- $36,384
- − Mortgage interest
- −$16,239
- − Property taxes
- −$1,658
- − Insurance
- −$1,450
- − Repairs & maintenance
- −$2,911
- − Management
- −$2,911
- − Depreciation
- −$8,433
- Taxable income
- $2,783
- Est. tax owed @ 24.0%
- −$668
- After-tax cash flow
- $6,725/yr
For passive investors: Depreciation is non-cash, so a rental often shows a tax loss while cash-flowing — sheltering income. Rental losses are passive: they offset passive income freely, and up to $25,000/yr can offset ordinary (W-2) income if you actively participate and your MAGI is under $100k (phasing out to $0 by $150k); unused losses carry forward. On sale, claimed depreciation is recaptured at up to 25%, and gains may owe capital-gains tax (a 1031 exchange can defer both). Figures are a year-1 estimate at your 24.0% rate — not tax advice; consult a CPA.
Schools (NCES district)
- District
- Waynesville R-VI
- NCES district ID
- 2931440
- Math proficiency
- 46% ▼ -1.00%
- Reading proficiency
- 53% ▼ -1.00%
- Median HH income
- $50,147
- Composite
- 42.36/100
- National rank
- #3246
- State rank
- #41 of 324 in MO
Livability — St. Robert
No livability data for this city. (Only ~50 U.S. cities are tracked.)
Census & demographics
- County
- Pulaski County · 25,264 people
- Metro
- Fort Leonard Wood, MO
- Population (ZIP)
- 10,553
- Household income
- $63,328
- Rent vs Own
- Severe rent burden
- 368.0
Population outlook (Pulaski County) Hauer SSP2
- Today (2025)
- 54,214 people
- By 2030
- 54,723 · +0.9%
- By 2040
- 54,885 · +1.2%
- By 2050
- 55,467 · +2.3%
- By 2075
- 58,576 · +8.0%
- By 2100
- 61,179 · +12.8%
Race, ethnicity, and origin ACS 2023
- Neighborhood character
- Diverse neighborhood (Simpson 0.56)
- Race & ethnicity
- White 65% Two or more races 15% Hispanic / Latino 11% Black 10% Asian 4%
- Hispanic origin (detail)
- Mexican 2% Puerto Rican 4%
- Common ancestry
- Slovak 3% Lithuanian 2% Italian 2%
- Foreign-born
- 6% · South Korea, Canada, China
- Languages at home
- 85% English-only · Spanish 5% German/W. Germanic 4% Korean 4%
Political lean MEDSL · Pulaski
- 2024 margin
- Solid R (+50.3) · D 24.2% · R 74.5% · Other 1.3%
- 2008→2024 swing
- -21.6pp toward R · 2008: -28.7pp · 2024: -50.3pp
- All cycles
- 2024: R+50.3 2020: R+45.7 2016: R+51.7 2012: R+36.1 2008: R+28.7
Not yet ingested
- Civics
- —
Market trends
- HPI YoY
- ▼ -30.16%
- Current HPI
- 130.0726
- Rent YoY
- ▲ 10.20%
- Metro
- Fort Leonard Wood, MO
- State GDP YoY
- ▲ 1.84%
- F500 in state
- 20
Industry mix (Fortune 500 HQ in MO)
| Industry | F500 HQs | Revenue |
|---|---|---|
| Healthcare | 1 | $163B |
|
||
| Insurance | 1 | $21B |
|
||
| Industrial Technology | 1 | $17B |
|
||
| Retail | 1 | $16B |
|
||
| Industrial Distribution | 1 | $10B |
|
||
| Utilities | 1 | $9B |
|
||
Price history
+29.7% since first listed15 events — show timeline
- 2026-06-01 Listed $289,900 MARIS as Distributed by MLS Grid
- 2024-01-29 Rental Removed $630 APPFOLIO
- 2023-12-28 Listed for Rent $630 APPFOLIO
- 2023-09-25 Sold (Public Records) $235,000 Public Records
- 2023-09-19 Sold (MLS) — MARIS as Distributed by MLS Grid
- 2023-08-24 Pending — MARIS as Distributed by MLS Grid
- 2023-08-23 Listed $239,900 MARIS as Distributed by MLS Grid
- 2019-08-02 Sold (Public Records) — Public Records
- 2019-07-31 Sold (MLS) — MARIS as Distributed by MLS Grid
- 2019-06-27 Pending — MARIS as Distributed by MLS Grid
- 2019-05-14 Listed $189,000 MARIS as Distributed by MLS Grid
- 2018-08-23 Price Changed $198,500 MARIS as Distributed by MLS Grid
- 2017-06-19 Price Changed $210,000 MARIS as Distributed by MLS Grid
- 2016-06-02 Price Changed $224,000 MARIS as Distributed by MLS Grid
- 2015-10-05 Price Changed $223,500 MARIS as Distributed by MLS Grid
Property tax history
+2.0%/yrLatest (2025): $1,658 · +5.2% YoY. Source: county tax records.
Cash-flow waterfall
monthlySold comps — $/sqft
last 12 mo · ≤1 miLoading sold comps…