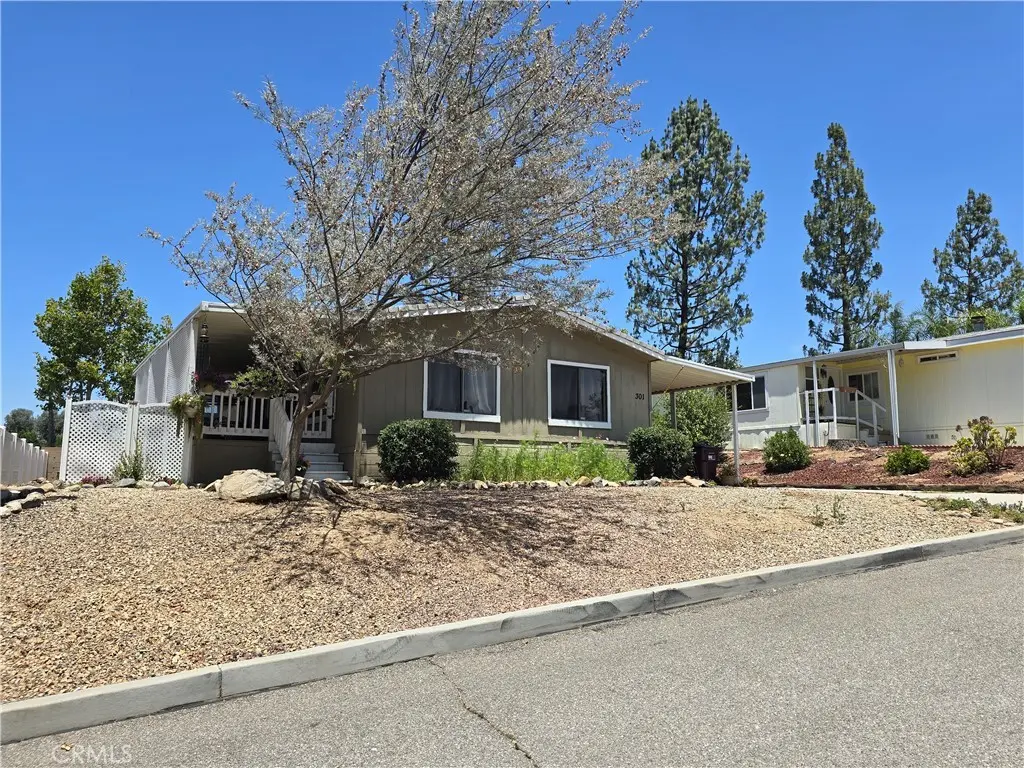
15181 Van Buren Blvd #301
Woodcrest, CA 92504
$194,900C+
2 bd · 2.0 ba ·
960 sqft ·
Built 1985
· Manufactured
· Active
· 3 DOM
Cashflow @ list (25.0% down · 7.5%)
Estimated rent
$2,227/mo
Mortgage (P&I)
−$1,022
Tax + insurance
−$325
HOA
−$0
Vac / Maint / Mgmt
−$468
Net cashflow
$413/mo
Annual
$4,952/yr
Cap rate
8.83%
Cash-on-cash
9.07%
DSCR
1.40
1% rule
1.14%
Cash to close
$54,572
Investor read
- This is a 2-bed/2.0-bath manufactured listed at $195k.
- At list price, monthly cash flow is $413 ($5k/yr) — positive.
- The deal already cash-flows at list — no discount required.
- Meets the 1% rule at list price ($2k rent vs $195k).
- Only 3 days on market — expect competitive offers; lowballing is unlikely to land.
- Local home prices are declining (-3.0%/yr); year-one equity from $1k of loan paydown is wiped out by about $6k of value loss. Plan a longer hold.
- Location reads 61/100 on livability (#518 in CA) — a middle-class / working-renter tenant base. Strengths: employment A+, housing A+; Watch: schools C-, crime C-, amenities F.
- Riverside Unified (urban): math 36% / reading 51% proficiency, ranked #574 of 1,400 in CA (top 41%) — families likely to look elsewhere, expect single-tenant / working-renter base with shorter leases.
- Market conditions: Rents rising fast (+5.7%/yr); 90 active listings in the ZIP; 3 comparable units currently listed for rent nearby; rentals leasing fast (median 5d on market — plan ~1-2 weeks tenant-placement turnaround); solid renter incomes; 9,195 units permitted in Riverside County in 2024 (1,512 in 5+ unit buildings).
- Riverside County population projected at +22% by 2050 — long-run rental-demand tailwind backs the buy-and-hold thesis.
- 5 sale attempts since 16y ago; this cycle's ask is 5% above the opening price — seller raised mid-cycle; expect resistance to lowballs.
- At projected returns (-3.0% appreciation + 5.7% rent growth), your $55k cash investment doubles in ~9 years — after that, you're playing with house money.
- Climate carrying-cost: severe wildfire risk; extreme-heat days projected 6→15/yr by 2055 (HVAC capex compounding) — expect insurance premiums to compound above CPI over the hold.
- Cap rate 8.8% vs local median 2.2% in Woodcrest — top-decile yield for the area; either an underpriced asset or a hidden risk that comps aren't pricing in. Stress-test before assuming the spread holds.
Questions for listing agent
- Is there a deadline driving the sale (1031 exchange, divorce, estate, relocation)? That informs how much negotiation room exists.
- What's the average days-on-market for RENTAL listings here right now (not sales)? A rising rental-DOM trend means longer vacancies and softer asking-rent achievability than the comps imply.
- What's the recent tenant-quality profile in this submarket — average credit score on applications, eviction rate, late-payment / NSF rate, and stable-employment percentage? A property-management company in the area should have these aggregated.
- How much new for-sale + rental construction is in the pipeline within 1–3 miles? Heavy new supply typically softens prices + rents 12–24 months out; constrained supply supports both.
CashFlowRE · CFR-NR32DX7JEM832X
· Data 2 days ago
cashflowre.app · 2026-05-29