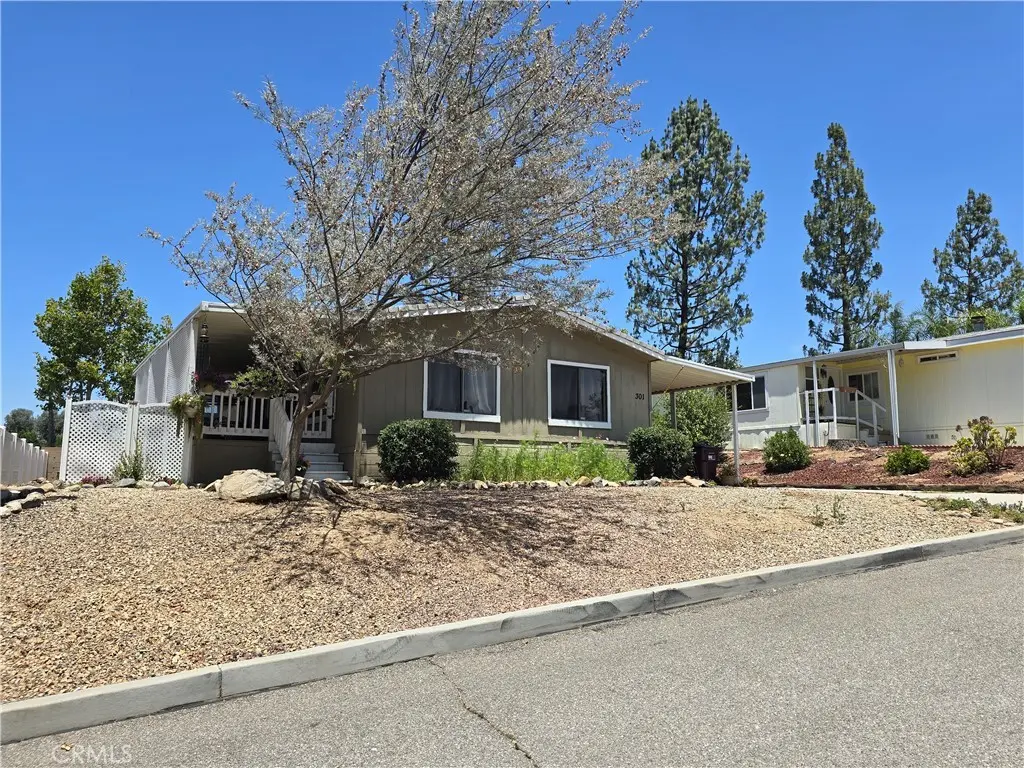
15181 Van Buren Blvd #301 · Woodcrest, CA
Flood risk 1/10 · Minimal
- FEMA flood zone
- X (unshaded)
- Chance of flooding over 30 yrs
- 0.0%
- Est. flood insurance / yr
- $507 – $1,088
Fire risk 9/10 · Severe
- Est. fire insurance / yr
- $659 – $1,223
Heat risk 6/10 · Moderate
- Hot days now (above 102°F)
- 6 days/yr
- Hot days in 30 yrs
- 15 days/yr
Wind risk 1/10 · Minimal
- Chance of severe wind over 30 yrs
- —
Air-quality risk 9/10 · Severe
- Unhealthy air days now
- 20 days/yr
- Unhealthy air days in 30 yrs
- 24 days/yr
Risk factors via First Street. Map © Google.
Why this score? — see what drove the C+ grade
The composite is a weighted blend of 9 inputs, each scored 0–100. Each bar is that input's sub-score; the figure is the points it added to the 100-point composite (weight × sub-score).
- Cash flow +24.8/30.0
- DSCR +8.0/10.0
- ARV discount +7.9/15.0
- 1% rule +6.4/10.0
- Schools +4.1/10.0
- Rent growth +3.9/5.0
- Livability +3.1/5.0
- Condition / age +2.5/5.0
- Appreciation +0.0/10.0
$194,900
🖨 Deal sheet 📄 Offer letter ✓ Due diligence
Listing remarks MLS
Welcome to this charming home in the highly desirable Rancho Caballero Mobile Home Park! Featuring 2 spacious bedrooms and 2 bathrooms, this cozy residence offers a comfortable and functional layout. The primary suite includes its own private bathroom and a generous walk-in closet. The open concept living area flows seamlessly into the kitchen, creating a warm and inviting space for relaxing or entertaining. Situated on a spacious lot, the home boasts a large backyard full of potential and a beautifully landscaped front yard with decorative rock accents. The extended driveway easily accommodates up to three vehicles. Rancho Caballero is one of Riverside’s most sought-after communities, offering resort-style amenities including two swimming pools, a relaxing spa, clubhouse, tennis court, two pickleball courts, and more. Don’t miss your chance to own a home in this vibrant and welcoming neighborhood—schedule your tour today!
Key facts
- Step saving kitchen
- Open layout
- Spacious living room
Tags
Property features AI
Finance
- Other: Property condition: Repairs cosmetic
- Financial info: Assessments: Unknown
- HOA & community: Land lease: $1,075 monthly (park); Park name: Rancho Caballero; Community features include storm drains and suburban setting; Rent includes pool (see remarks)
Exterior
- Parking: 2 parking spaces; 2 carport spaces
- Security: Manager approval required for park residency
- Utilities: Electricity on property; Electricity connected; Natural gas connected; Sewer connected (public sewer); Water connected (district/public)
- Home design: Single-story home; Entry on side; Entry level: 1; Mobile home (24' x 40') — model GV409A0; Mobile home remains; One total story
- Construction: Vinyl and wood frame construction; Pier jacks foundation
- Exterior features: Shingle roof; Covered wood porch and patio; Patio; Lighting; In-ground community pool; Shed (1); Flat rectangular lot with front and back yard; Private paved road frontage; South-facing; Has view
Interior
- Kitchen: Built-in range; Water heater unit; Formica counters; Kitchen open to family room; Gas water heater
- Bedrooms: All bedrooms on main level; Main floor primary bedroom; Walk-in closet
- Flooring: Laminate flooring
- Bathrooms: 2 full bathrooms; Main floor full bath; Shower in tub
- Heating & cooling: Central cooling; Central furnace heating
- Interior features: Open floor plan; High ceilings (9 feet+); Laminate counters; Blinds and screens; No interior steps; Community spa
- Laundry & utility: Laundry inside; Gas dryer hookup; Washer/dryer hookups available
Neighborhood map
What this means for you Summary
Snapshot
- This is a 2-bed/2.0-bath manufactured listed at $195k.
Deal economics
- At list price, monthly cash flow is $413 ($5k/yr) — positive.
- The deal already cash-flows at list — no discount required.
- Meets the 1% rule at list price ($2k rent vs $195k).
- Cap rate 8.8% vs local median 2.2% in Woodcrest — top-decile yield for the area; either an underpriced asset or a hidden risk that comps aren't pricing in. Stress-test before assuming the spread holds.
Location & tenants
- Location reads 61/100 on livability (#518 in CA) — a middle-class / working-renter tenant base. Strengths: employment A+, housing A+; Watch: schools C-, crime C-, amenities F.
- Riverside Unified (urban): math 36% / reading 51% proficiency, ranked #574 of 1,400 in CA (top 41%) — families likely to look elsewhere, expect single-tenant / working-renter base with shorter leases.
- Market conditions: Rents rising fast (+5.7%/yr); 90 active listings in the ZIP; 3 comparable units currently listed for rent nearby; rentals leasing fast (median 5d on market — plan ~1-2 weeks tenant-placement turnaround); solid renter incomes; 9,195 units permitted in Riverside County in 2024 (1,512 in 5+ unit buildings).
Forward outlook
- Local home prices are declining (-3.0%/yr); year-one equity from $1k of loan paydown is wiped out by about $6k of value loss. Plan a longer hold.
- Riverside County population projected at +22% by 2050 — long-run rental-demand tailwind backs the buy-and-hold thesis.
- At projected returns (-3.0% appreciation + 5.7% rent growth), your $55k cash investment doubles in ~9 years — after that, you're playing with house money.
Negotiation context
- Only 3 days on market — expect competitive offers; lowballing is unlikely to land.
- 5 sale attempts since 16y ago; this cycle's ask is 5% above the opening price — seller raised mid-cycle; expect resistance to lowballs.
Risks & watch-outs
- Climate carrying-cost: severe wildfire risk; extreme-heat days projected 6→15/yr by 2055 (HVAC capex compounding) — expect insurance premiums to compound above CPI over the hold.
Questions for the listing agent
- Is there a deadline driving the sale (1031 exchange, divorce, estate, relocation)? That informs how much negotiation room exists.
- What's the average days-on-market for RENTAL listings here right now (not sales)? A rising rental-DOM trend means longer vacancies and softer asking-rent achievability than the comps imply.
- What's the recent tenant-quality profile in this submarket — average credit score on applications, eviction rate, late-payment / NSF rate, and stable-employment percentage? A property-management company in the area should have these aggregated.
- How much new for-sale + rental construction is in the pipeline within 1–3 miles? Heavy new supply typically softens prices + rents 12–24 months out; constrained supply supports both.
Investment metrics
- 1% rule
- 1.14% ✓
- Cap rate
- 8.83%
- Cash-on-cash
- 9.07%
- DSCR
- 1.40
- GRM
- 7.3
CMA / ARV
- ARV (on-the-fly)
- $196,800
- Comps found
- 2
Show comp detail 2 sales within ~0.75 mi
| Address | Dist | Beds/Ba | Sqft | Sold | Price | $/sf | Match |
|---|---|---|---|---|---|---|---|
| 15181 Van Buren Blvd #301 | 0.00mi | 2/2.0 | 960 (0%) | 9mo | $186,000 | $194 | 93 |
| 15181 Van Buren | 0.00mi | 3/2.0 (+1) | 880 (-8%) | 2mo | $180,000 | $205 | 80 |
Match score weights: distance 35% · size 25% · config 20% · recency 20%. Top-matched comps best support the ARV.
Projected returns pro-forma
-3.0% appreciation · 5.67% rent growth · sell at horizon
- IRR
- 0.4%
- Equity multiple
- 1.02×
- Total profit
- $877
- Equity at exit
- $29,060
- IRR
- 12.6%
- Equity multiple
- 2.12×
- Total profit
- $61,371
- Equity at exit
- $16,851
Cash invested: $54,572 (down + closing). Projections, not guarantees.
Landlord ↔ Tenant lean methodology
- Overall (STATE)
- 18 Strongly Tenant-Friendly
- State California
- 18 Strongly Tenant-Friendly · D+13
- County
- — inherits STATE
- City
- — inherits STATE
ZIP-level market 92504
- Rents YoY
- 5.7%
- Active inventory
- 90
- Price-to-rent
- 7.3×
Monthly cashflow live
- Estimated rent
- $2,227 medium interval (Pro) →
- Mortgage (P&I)
- −$1,022
- Tax est. 1.5%
- −$244 /mo · $2,924/yr
- Insurance
- −$81
- HOA
- −$0
- Vacancy / Maint / Mgmt
- −$468
- Net cashflow
- $413
Break-even live
UW: 25.0% down · 7.5% · 30yr · 1.5% tax · 5.0% vac · 8.0% maint · 8.0% mgmt
Financing live
Cash to close
- Down payment
- $48,725
- Closing costs
- $5,847
- Reserves months
- —
- Total cash needed
- —
Loan-product check · same deal, 3 products live
Conventional
25% down · 7.5% · 30yr
- Down + closing
- —
- Monthly P&I
- —
- Monthly cashflow
- —
- DSCR
- —
- Eligible?
- —
Personal DTI + credit; lowest rate.
DSCR
20% down · 8.5% · 30yr
- Down + closing
- —
- Monthly P&I
- —
- Monthly cashflow
- —
- DSCR
- —
- Eligible?
- —
No personal income docs; deal must DSCR.
Hard money
10% down · 12.0% · 12mo
- Down + closing
- —
- Monthly P&I
- —
- Monthly cashflow
- —
- DSCR
- —
- Eligible?
- —
Short-term bridge; refi at stabilization.
Rent comps 3 comps
| Address | Beds | Baths | Sqft | Rent | $/sqft | DOM | Units | Dist |
|---|---|---|---|---|---|---|---|---|
| 16877 Orangecrest Ct Unit B Riverside, CA | 1.0 | 1.0 | 1000 | $2,100 | $2.10 | 5d | 1 | 0.79mi |
| 16875 Orangecrest Ct Riverside, CA | 1.0 | 1.0 | 1000 | $2,100 | $2.10 | 2d | 1 | 0.82mi |
| 16875 Orangecrest Ct Unit B Riverside, CA | 1.0 | 1.0 | 1033 | $2,100 | $2.03 | 5d | 1 | 0.82mi |
Listing history 7 events
-
2026-06-18days on market $194,900 Active 3 DOM
-
2026-06-17days on market $194,900 Active 2 DOM
-
2026-06-15statusdays on market $194,900 Active 1 DOM
-
2026-06-15days on market $194,900 Coming Soon 4 DOM
-
2026-06-13days on market $194,900 Coming Soon 2 DOM
-
2026-06-13remarks 695-char remark
-
2026-06-13$194,900 Coming Soon 1 DOM
ⓘ Source: listings_history table (triggers on properties + properties_extension) + one-shot
backfill from property_details.listing_events for pre-trigger history.
Climate risk First Street
- Flood 1/10 Low FEMA zone X (unshaded) · 0% chance over 30 yrs
- Wildfire 9/10 Extreme
- Heat 6/10 Major 6 d/yr ≥102°F today · 15 d/yr by 30 yrs out
- Wind 1/10 Low
- Air quality 9/10 Extreme 20 unhealthy d/yr today · 24 by 30 yrs out
Nearby sold comps map
Loading sold comps map…
Walkable amenities ~0.75 mi
Loading nearby amenities…
Taxation est. · year 1
- Rental income
- $26,728
- − Mortgage interest
- −$10,917
- − Property taxes
- −$2,924
- − Insurance
- −$974
- − Repairs & maintenance
- −$2,138
- − Management
- −$2,138
- − Depreciation
- −$5,670
- Taxable income
- $1,966
- Est. tax owed @ 24.0%
- −$472
- After-tax cash flow
- $4,480/yr
For passive investors: Depreciation is non-cash, so a rental often shows a tax loss while cash-flowing — sheltering income. Rental losses are passive: they offset passive income freely, and up to $25,000/yr can offset ordinary (W-2) income if you actively participate and your MAGI is under $100k (phasing out to $0 by $150k); unused losses carry forward. On sale, claimed depreciation is recaptured at up to 25%, and gains may owe capital-gains tax (a 1031 exchange can defer both). Figures are a year-1 estimate at your 24.0% rate — not tax advice; consult a CPA.
Schools (NCES district)
- District
- Riverside Unified
- NCES district ID
- 0633150
- Math proficiency
- 36% ▲ 1.00%
- Reading proficiency
- 51% ▲ 2.00%
- Median HH income
- $62,038
- Composite
- 40.8/100
- National rank
- #7563
- State rank
- #574 of 1400 in CA
Livability — Woodcrest
- Score
- 61/100
- State rank
- #518
- US rank
- #17500
Category grades
Schools grade is shown separately in the Schools card above.
Census & demographics
- Census place
- Woodcrest, CA
- County
- Riverside County · 2,287,001 people
- Metro
- Riverside-San Bernardino-Ontario, CA
- Population (ZIP)
- 57,132
- Household income
- $92,477
- Rent vs Own
- Severe rent burden
- 1669.0
Population outlook (Riverside County) Hauer SSP2
- Today (2025)
- 2,664,475 people
- By 2030
- 2,802,692 · +5.2%
- By 2040
- 3,050,904 · +14.5%
- By 2050
- 3,256,783 · +22.2%
- By 2075
- 3,655,058 · +37.2%
- By 2100
- 3,766,594 · +41.4%
Race, ethnicity, and origin ACS 2023
- Neighborhood character
- Diverse neighborhood (Simpson 0.60)
- Race & ethnicity
- Hispanic / Latino 56% White 28% Two or more races 14% Black 8% Asian 4%
- Hispanic origin (detail)
- Mexican 48%
- Common ancestry
- Slovak 1% Italian 1% Lithuanian 1%
- Foreign-born
- 20% · Canada, Vietnam, China
- Languages at home
- 58% English-only · Spanish 37% Chinese 1% Vietnamese 1%
Political lean MEDSL · Riverside
- 2024 margin
- Toss-up / Even · D 48.0% · R 49.3% · Other 2.6%
- 2008→2024 swing
- -3.6pp toward R · 2008: 2.3pp · 2024: -1.3pp
- All cycles
- 2024: R+1.3 2020: D+8.0 2016: D+4.3 2012: R+0.4 2008: D+2.3
Not yet ingested
- Civics
- —
Market trends
- HPI YoY
- ▼ -457.73%
- Current HPI
- 414.1936
- Rent YoY
- ▲ 5.67%
- Metro
- Riverside-San Bernardino-Ontario, CA
- State GDP YoY
- ▲ 3.21%
- F500 in state
- 116
Industry mix (Fortune 500 HQ in CA)
| Industry | F500 HQs | Revenue |
|---|---|---|
| Technology | 27 | $1,492B |
|
||
| Financial Services | 3 | $174B |
|
||
| Retail | 3 | $44B |
|
||
| Insurance | 3 | $26B |
|
||
| Media / Entertainment | 2 | $115B |
|
||
| Pharmaceuticals / Biotech | 2 | $62B |
|
||
Price history
+596.1% since first listed18 events — show timeline
- 2026-06-11 Coming Soon $194,900 CRMLS
- 2025-10-03 Sold (MLS) $186,000 CRMLS
- 2025-08-22 Pending — CRMLS
- 2025-08-08 Relisted — CRMLS
- 2025-07-25 Listed $185,000 CRMLS
- 2025-07-25 Coming Soon $185,000 CRMLS
- 2023-11-30 Sold (MLS) $170,000 CRMLS
- 2023-10-23 Contingent — CRMLS
- 2023-10-02 Listed $170,000 CRMLS
- 2023-09-26 Coming Soon $170,000 CRMLS
- 2014-09-08 Listing Removed — CRMLS
- 2014-06-29 Price Changed $45,000 CRMLS
- 2014-03-15 Price Changed $48,500 CRMLS
- 2014-03-03 Price Changed $50,000 CRMLS
- 2014-01-28 Listed $55,000 CRMLS
- 2010-08-31 Listing Removed — CRMLS
- 2010-08-20 Price Changed $26,000 CRMLS
- 2010-08-06 Listed $28,000 CRMLS
Property tax history
-1.0%/yrLatest (2025): $279 · +3.4% YoY. Source: county tax records.
Cash-flow waterfall
monthlySold comps — $/sqft
last 12 mo · ≤1 miLoading sold comps…