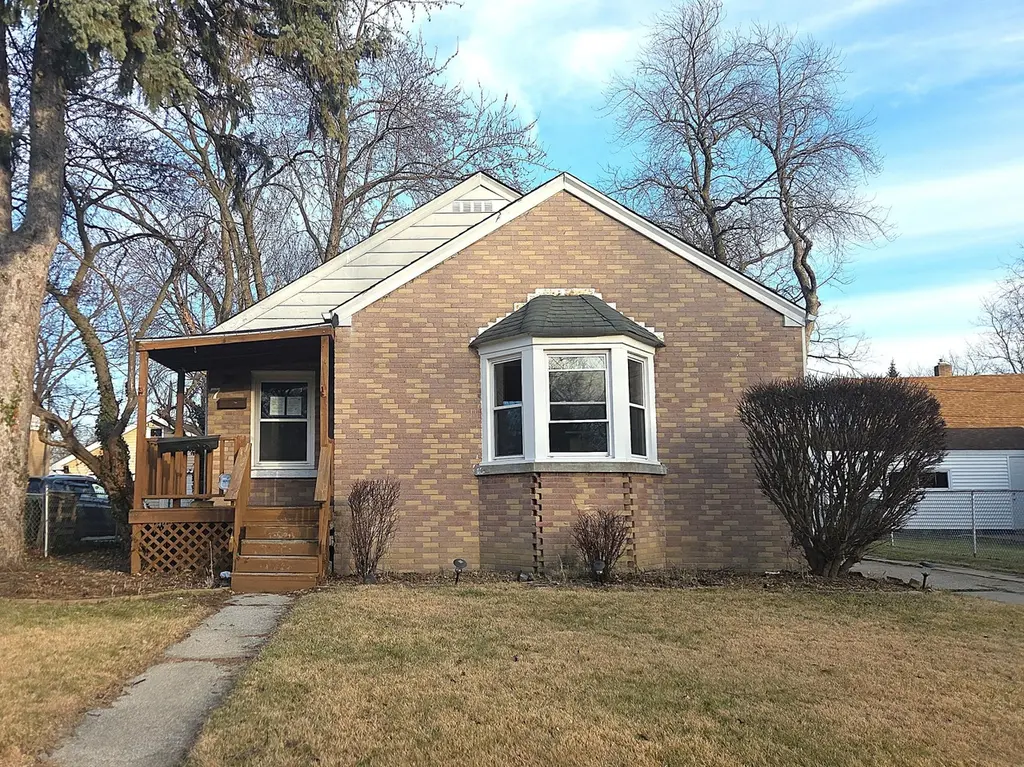
7 Beverly Blvd
Hobart, IN 46342
$168,000C+
3 bd · 1.0 ba ·
2,425 sqft ·
Built 1940
· SingleFamily
· Pending
· 5 DOM
Cashflow @ list (25.0% down · 7.5%)
Estimated rent
$1,856/mo
Mortgage (P&I)
−$881
Tax + insurance
−$297
HOA
−$0
Vac / Maint / Mgmt
−$390
Net cashflow
$288/mo
Annual
$3,458/yr
Cap rate
8.35%
Cash-on-cash
7.35%
DSCR
1.33
1% rule
1.10%
Cash to close
$47,040
Investor read
- This is a 3-bed/1.0-bath single-family listed at $168k.
- At list price, monthly cash flow is $288 ($3k/yr) — positive.
- The deal already cash-flows at list — no discount required.
- Meets the 1% rule at list price ($2k rent vs $168k).
- Only 5 days on market — expect competitive offers; lowballing is unlikely to land.
- Local home prices are declining (-3.0%/yr); year-one equity from $1k of loan paydown is wiped out by about $5k of value loss. Plan a longer hold.
- Location reads 69/100 on livability (#196 in IN) — a middle-class / working-renter tenant base. Strengths: cost of living A+, housing A+, crime B; Watch: amenities F, commute F, health & safety D-.
- School City Of Hobart (suburban): math 30% / reading 45% proficiency, ranked #161 of 301 in IN (top 54%) — families likely to look elsewhere, expect single-tenant / working-renter base with shorter leases.
- Zoned schools: Hobart Middle School (math 23% / reading 42%, grade F, #186 of 330 statewide, top 57%, 917 students, 54% FRL); Hobart High School (math 25% / reading 65%, grade D-, #166 of 369 statewide, top 45%, 1,306 students, 48% FRL).
- Watch-outs: built in 1940 — expect roof / HVAC / electrical / plumbing capex.
- Market conditions: Rents rising fast (+5.6%/yr); 261 active listings in the ZIP; 1 comparable units currently listed for rent nearby; solid renter incomes; 1,642 units permitted in Lake County in 2024 (14 in 5+ unit buildings).
- Lake County population projected to shrink 7% by 2050 — rents likely to lag national; underwrite the cash flow, not the appreciation.
- 6 sale attempts since 28y ago with the ask held roughly flat each time — persistent listings suggest the price (not the market) is what's stuck; bring a comps-based counter.
- At projected returns (-3.0% appreciation + 5.6% rent growth), your $47k cash investment doubles in ~10 years — after that, you're playing with house money.
- Cap rate 8.4% vs local median 4.2% in Hobart — top-decile yield for the area; either an underpriced asset or a hidden risk that comps aren't pricing in. Stress-test before assuming the spread holds.
Questions for listing agent
- Built in 1940 — when were the roof, HVAC, electrical panel, plumbing, and water heater last replaced?
- Is there a deadline driving the sale (1031 exchange, divorce, estate, relocation)? That informs how much negotiation room exists.
- Schools are D-rated, which usually means shorter tenancies and higher turnover. Who's the typical renter profile here, and what's been the actual vacancy rate?
- What's the average days-on-market for RENTAL listings here right now (not sales)? A rising rental-DOM trend means longer vacancies and softer asking-rent achievability than the comps imply.
- What's the recent tenant-quality profile in this submarket — average credit score on applications, eviction rate, late-payment / NSF rate, and stable-employment percentage? A property-management company in the area should have these aggregated.
- How much new for-sale + rental construction is in the pipeline within 1–3 miles? Heavy new supply typically softens prices + rents 12–24 months out; constrained supply supports both.
CashFlowRE · CFR-NT59FKC366VXCJ
· Data 3 weeks ago
cashflowre.app · 2026-05-29