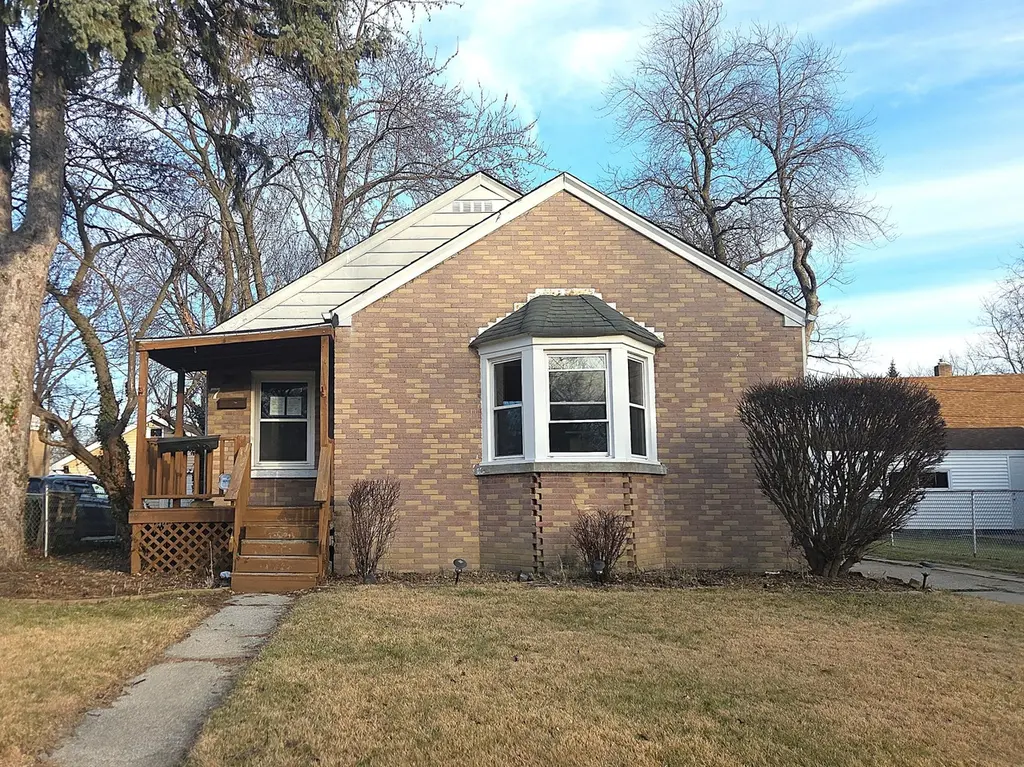
7 Beverly Blvd · Hobart, IN
Flood risk 1/10 · Minimal
- FEMA flood zone
- X (unshaded)
- Chance of flooding over 30 yrs
- 0.0%
- Est. flood insurance / yr
- $473 – $860
Fire risk 3/10 · Minor
- Est. fire insurance / yr
- $717 – $1,331
Heat risk 2/10 · Minimal
- Hot days now (above 102°F)
- 7 days/yr
- Hot days in 30 yrs
- 15 days/yr
Wind risk 2/10 · Minimal
- Chance of severe wind over 30 yrs
- 0.0%
Air-quality risk 3/10 · Minor
- Unhealthy air days now
- 2 days/yr
- Unhealthy air days in 30 yrs
- 3 days/yr
Risk factors via First Street. Map © Google.
Why this score? — see what drove the C+ grade
The composite is a weighted blend of 9 inputs, each scored 0–100. Each bar is that input's sub-score; the figure is the points it added to the 100-point composite (weight × sub-score).
- Cash flow +22.7/30.0
- ARV discount +15.0/15.0
- DSCR +7.3/10.0
- 1% rule +6.0/10.0
- Rent growth +3.9/5.0
- Livability +3.5/5.0
- Schools +3.3/10.0
- Condition / age +2.5/5.0
- Appreciation +0.0/10.0
$168,000
🖨 Deal sheet 📄 Offer letter ✓ Due diligence
Listing remarks
Investors welcome! Charming brick and vinyl Cape Cod with over 1,500 sq ft of above ground living space, hardwood floors, and vinyl windows. Spacious kitchen offers modern cabinetry, updated countertops, a large island, tile flooring, and a bright bump out window with an eating area. Sun filled living room plus an absolutely massive family room with a fireplace and bar area, perfect for entertaining and large enough to create a second seating area, play space, or office zone. Versatile tandem room works as a dining room, office, or flex space. Basement includes a started room and plenty of storage. Outside features a large deck, above ground pool, storage shed, fenced yard, and a 2 car gara
Key facts
- Modern cabinetry
- Large island
- Updated countertops
Tags
Neighborhood map
What this means for you Summary
Snapshot
- This is a 3-bed/1.0-bath single-family listed at $168k.
Deal economics
- At list price, monthly cash flow is $288 ($3k/yr) — positive.
- The deal already cash-flows at list — no discount required.
- Meets the 1% rule at list price ($2k rent vs $168k).
- Cap rate 8.4% vs local median 4.2% in Hobart — top-decile yield for the area; either an underpriced asset or a hidden risk that comps aren't pricing in. Stress-test before assuming the spread holds.
Location & tenants
- Location reads 69/100 on livability (#196 in IN) — a middle-class / working-renter tenant base. Strengths: cost of living A+, housing A+, crime B; Watch: amenities F, commute F, health & safety D-.
- School City Of Hobart (suburban): math 30% / reading 45% proficiency, ranked #161 of 301 in IN (top 54%) — families likely to look elsewhere, expect single-tenant / working-renter base with shorter leases.
- Zoned schools: Hobart Middle School (math 23% / reading 42%, grade F, #186 of 330 statewide, top 57%, 917 students, 54% FRL); Hobart High School (math 25% / reading 65%, grade D-, #166 of 369 statewide, top 45%, 1,306 students, 48% FRL).
- Market conditions: Rents rising fast (+5.6%/yr); 255 active listings in the ZIP; 1 comparable units currently listed for rent nearby; solid renter incomes; 1,642 units permitted in Lake County in 2024 (14 in 5+ unit buildings).
Forward outlook
- Local home prices are declining (-3.0%/yr); year-one equity from $1k of loan paydown is wiped out by about $5k of value loss. Plan a longer hold.
- Lake County population projected to shrink 7% by 2050 — rents likely to lag national; underwrite the cash flow, not the appreciation.
- At projected returns (-3.0% appreciation + 5.6% rent growth), your $47k cash investment doubles in ~10 years — after that, you're playing with house money.
Negotiation context
- Only 5 days on market — expect competitive offers; lowballing is unlikely to land.
- 6 sale attempts since 28y ago with the ask held roughly flat each time — persistent listings suggest the price (not the market) is what's stuck; bring a comps-based counter.
Risks & watch-outs
- Watch-outs: built in 1940 — expect roof / HVAC / electrical / plumbing capex.
Questions for the listing agent
- Built in 1940 — when were the roof, HVAC, electrical panel, plumbing, and water heater last replaced?
- Is there a deadline driving the sale (1031 exchange, divorce, estate, relocation)? That informs how much negotiation room exists.
- Schools are D-rated, which usually means shorter tenancies and higher turnover. Who's the typical renter profile here, and what's been the actual vacancy rate?
- What's the average days-on-market for RENTAL listings here right now (not sales)? A rising rental-DOM trend means longer vacancies and softer asking-rent achievability than the comps imply.
- What's the recent tenant-quality profile in this submarket — average credit score on applications, eviction rate, late-payment / NSF rate, and stable-employment percentage? A property-management company in the area should have these aggregated.
- How much new for-sale + rental construction is in the pipeline within 1–3 miles? Heavy new supply typically softens prices + rents 12–24 months out; constrained supply supports both.
Investment metrics
- 1% rule
- 1.10% ✓
- Cap rate
- 8.35%
- Cash-on-cash
- 7.35%
- DSCR
- 1.33
- GRM
- 7.5
CMA / ARV
- ARV (on-the-fly)
- $334,650
- Comps found
- 12
Show comp detail 12 sales within ~0.75 mi
| Address | Dist | Beds/Ba | Sqft | Sold | Price | $/sf | Match |
|---|---|---|---|---|---|---|---|
| 147 S Connecticut St | 0.19mi | 3/1.5 | 2,254 (-7%) | 1mo | $239,900 | $106 | 76 |
| 202 Beverly Ln | 0.15mi | 3/3.0 | 2,520 (+4%) | 3mo | $349,000 | $138 | 76 |
| 312 W Old Ridge Rd | 0.20mi | 3/2.5 | 2,324 (-4%) | 8mo | $350,000 | $151 | 71 |
| 130 W 2nd St | 0.22mi | 3/2.0 | 2,222 (-8%) | 4mo | $200,000 | $90 | 69 |
| 248 N Washington St | 0.42mi | 4/2.0 (+1) | 2,364 (-2%) | 5mo | $310,000 | $131 | 64 |
| 54 N Michigan Ave | 0.55mi | 4/2.5 (+1) | 2,380 (-2%) | 3mo | $350,000 | $147 | 58 |
| 808 E 3rd St | 0.71mi | 4/3.0 (+1) | 2,388 (-2%) | 1mo | $290,000 | $121 | 50 |
| 126 Cressmoor Blvd | 0.68mi | 4/2.5 (+1) | 2,356 (-3%) | 4mo | $352,990 | $150 | 50 |
| 121 Cressmoor Blvd | 0.68mi | 4/2.5 (+1) | 2,356 (-3%) | 6mo | $397,490 | $169 | 48 |
| 182 Quail Dr | 0.68mi | 4/3.0 (+1) | 2,301 (-5%) | 8mo | $350,000 | $152 | 40 |
| 1115 W Old Ridge Rd | 0.61mi | 2/2.0 (-1) | 2,128 (-12%) | 6mo | $241,775 | $114 | 37 |
| 318 N Delaware St | 0.72mi | 4/2.0 (+1) | 2,064 (-15%) | 0mo | $245,000 | $119 | 32 |
Match score weights: distance 35% · size 25% · config 20% · recency 20%. Top-matched comps best support the ARV.
Projected returns pro-forma
-3.0% appreciation · 5.63% rent growth · sell at horizon
- IRR
- -2.1%
- Equity multiple
- 0.92×
- Total profit
- $-3,791
- Equity at exit
- $25,049
- IRR
- 10.3%
- Equity multiple
- 1.90×
- Total profit
- $42,314
- Equity at exit
- $14,526
Cash invested: $47,040 (down + closing). Projections, not guarantees.
Landlord ↔ Tenant lean methodology
- Overall (STATE)
- 90 Strongly Landlord-Friendly
- State Indiana
- 90 Strongly Landlord-Friendly · R+11
- County
- — inherits STATE
- City
- — inherits STATE
ZIP-level market 46342
- Rents YoY
- 5.6%
- Active inventory
- 255
- Price-to-rent
- 7.5×
Monthly cashflow live
- Estimated rent
- $1,856 medium interval (Pro) →
- Mortgage (P&I)
- −$881
- Tax from tax record
- −$227 /mo · $2,720/yr
- Insurance
- −$70
- HOA
- −$0
- Vacancy / Maint / Mgmt
- −$390
- Net cashflow
- $288
Break-even live
UW: 25.0% down · 7.5% · 30yr · 1.5% tax · 5.0% vac · 8.0% maint · 8.0% mgmt
Financing live
Cash to close
- Down payment
- $42,000
- Closing costs
- $5,040
- Reserves months
- —
- Total cash needed
- —
Loan-product check · same deal, 3 products live
Conventional
25% down · 7.5% · 30yr
- Down + closing
- —
- Monthly P&I
- —
- Monthly cashflow
- —
- DSCR
- —
- Eligible?
- —
Personal DTI + credit; lowest rate.
DSCR
20% down · 8.5% · 30yr
- Down + closing
- —
- Monthly P&I
- —
- Monthly cashflow
- —
- DSCR
- —
- Eligible?
- —
No personal income docs; deal must DSCR.
Hard money
10% down · 12.0% · 12mo
- Down + closing
- —
- Monthly P&I
- —
- Monthly cashflow
- —
- DSCR
- —
- Eligible?
- —
Short-term bridge; refi at stabilization.
Rent comps 1 comps
| Address | Beds | Baths | Sqft | Rent | $/sqft | DOM | Units | Dist |
|---|---|---|---|---|---|---|---|---|
| 600 W 39th Pl Hobart, IN | 3.0 | 3.0 | 1601 | $2,615 | $1.63 | 1d | 1 | 0.73mi |
Listing history 14 events
-
2026-04-13status Pending
-
2026-04-07$168,000 Active
-
2026-02-10status Pending
-
2026-02-10historical
-
2026-01-28price $168,000
-
2025-12-16$210,000 Active
-
2025-10-28$192,920 Active
-
2024-11-14price $195,040
-
2024-08-14$187,320 Active
-
2022-10-18soldstatus $219,900 Closed
-
2022-10-10status Pending
-
2022-09-10historical Active Under Contract
-
2022-09-01$219,900 Active
-
1998-11-19$79,900
ⓘ Source: listings_history table (triggers on properties + properties_extension) + one-shot
backfill from property_details.listing_events for pre-trigger history.
Tax reassessment forecast IN · Partial reset (capped growth)
- Current annual tax
- $2,720 · $227/mo
- Projected year-2 tax
- $2,720 · $227/mo
- Expected delta
- $0/yr ($0/mo · 0.0%)
ⓘ Screening estimate from a state-policy table — verify with the county assessor before closing.
Climate risk First Street
- Flood 1/10 Low FEMA zone X (unshaded) · 0% chance over 30 yrs
- Wildfire 3/10 Moderate
- Heat 2/10 Low 7 d/yr ≥102°F today · 15 d/yr by 30 yrs out
- Wind 2/10 Low 0% chance of damaging wind over 30 yrs
- Air quality 3/10 Moderate 2 unhealthy d/yr today · 3 by 30 yrs out
Nearby sold comps map
Loading sold comps map…
Walkable amenities ~0.75 mi
Loading nearby amenities…
Taxation est. · year 1
- Rental income
- $22,266
- − Mortgage interest
- −$9,411
- − Property taxes
- −$2,720
- − Insurance
- −$840
- − Repairs & maintenance
- −$1,781
- − Management
- −$1,781
- − Depreciation
- −$4,887
- Taxable income
- $846
- Est. tax owed @ 24.0%
- −$203
- After-tax cash flow
- $3,255/yr
For passive investors: Depreciation is non-cash, so a rental often shows a tax loss while cash-flowing — sheltering income. Rental losses are passive: they offset passive income freely, and up to $25,000/yr can offset ordinary (W-2) income if you actively participate and your MAGI is under $100k (phasing out to $0 by $150k); unused losses carry forward. On sale, claimed depreciation is recaptured at up to 25%, and gains may owe capital-gains tax (a 1031 exchange can defer both). Figures are a year-1 estimate at your 24.0% rate — not tax advice; consult a CPA.
Schools (NCES district)
- District
- School City Of Hobart
- NCES district ID
- 1804590
- Math proficiency
- 30% ▼ -14.00%
- Reading proficiency
- 45% ▼ -7.00%
- Median HH income
- $55,967
- Composite
- 32.93/100
- National rank
- #5594
- State rank
- #161 of 301 in IN
Livability — Hobart
- Score
- 69/100
- State rank
- #196
- US rank
- #8834
Category grades
Schools grade is shown separately in the Schools card above.
Census & demographics
- Census place
- Hobart, IN
- County
- Lake County · 422,878 people
- City population
- 32,224
- Metro
- Chicago-Naperville-Elgin, IL-IN-WI
- Population (ZIP)
- 32,224
- Household income
- $75,521
- Rent vs Own
- Severe rent burden
- 1033.0
Population outlook (Lake County) Hauer SSP2
- Today (2025)
- 484,026 people
- By 2030
- 478,091 · -1.2%
- By 2040
- 462,974 · -4.3%
- By 2050
- 449,894 · -7.1%
- By 2075
- 436,169 · -9.9%
- By 2100
- 426,607 · -11.9%
Race, ethnicity, and origin ACS 2023
- Neighborhood character
- Predominantly White (66%)
- Race & ethnicity
- White 66% Hispanic / Latino 21% Two or more races 10% Black 10% Asian 1%
- Hispanic origin (detail)
- Mexican 15% Puerto Rican 5%
- Common ancestry
- Romanian 11% Iranian 2% Lithuanian 1%
- Foreign-born
- 5% · Canada, China
- Languages at home
- 87% English-only · Spanish 9% Russian/Polish/Slavic 2% Chinese 1%
Political lean MEDSL · Lake
- 2024 margin
- Lean D (+5.6) · D 52.1% · R 46.5% · Other 1.5%
- 2008→2024 swing
- -28.6pp toward R · 2008: 34.3pp · 2024: 5.6pp
- All cycles
- 2024: D+5.6 2020: D+15.1 2016: D+20.6 2012: D+31.0 2008: D+34.3
Not yet ingested
- Civics
- —
Market trends
- HPI YoY
- ▼ -167.01%
- Current HPI
- 260.2635
- Rent YoY
- ▲ 5.63%
- Metro
- Chicago-Naperville-Elgin, IL-IN-WI
- State GDP YoY
- ▲ 2.90%
- F500 in state
- 18
Industry mix (Fortune 500 HQ in IN)
| Industry | F500 HQs | Revenue |
|---|---|---|
| Industrial Machinery | 2 | $37B |
|
||
| Healthcare | 1 | $177B |
|
||
| Pharmaceuticals | 1 | $45B |
|
||
| Metals / Steel | 1 | $18B |
|
||
| Agriculture | 1 | $17B |
|
||
| Packaging | 1 | $12B |
|
||
Price history
+110.3% since first listed14 events — show timeline
- 2026-04-13 Pending — NIRA MLS as Distributed by MLS Grid
- 2026-04-07 Listed $168,000 NIRA MLS as Distributed by MLS Grid
- 2026-02-10 Pending — NIRA MLS as Distributed by MLS Grid
- 2026-02-10 Listing Removed — NIRA MLS as Distributed by MLS Grid
- 2026-01-28 Price Changed $168,000 NIRA MLS as Distributed by MLS Grid
- 2025-12-16 Listed $210,000 NIRA MLS as Distributed by MLS Grid
- 2025-10-28 Listed $192,920 IRMLS
- 2024-11-14 Price Changed $195,040 IRMLS
- 2024-08-14 Listed $187,320 IRMLS
- 2022-10-18 Sold (MLS) $219,900 NIRA MLS as Distributed by MLS Grid
- 2022-10-10 Pending — NIRA MLS as Distributed by MLS Grid
- 2022-09-10 Contingent — NIRA MLS as Distributed by MLS Grid
- 2022-09-01 Listed $219,900 NIRA MLS as Distributed by MLS Grid
- 1998-11-19 Listed $79,900 NIRA MLS as Distributed by MLS Grid
Property tax history
+9.7%/yrLatest (2024): $2,720 · +0.7% YoY. Source: county tax records.
Cash-flow waterfall
monthlySold comps — $/sqft
last 12 mo · ≤1 miLoading sold comps…