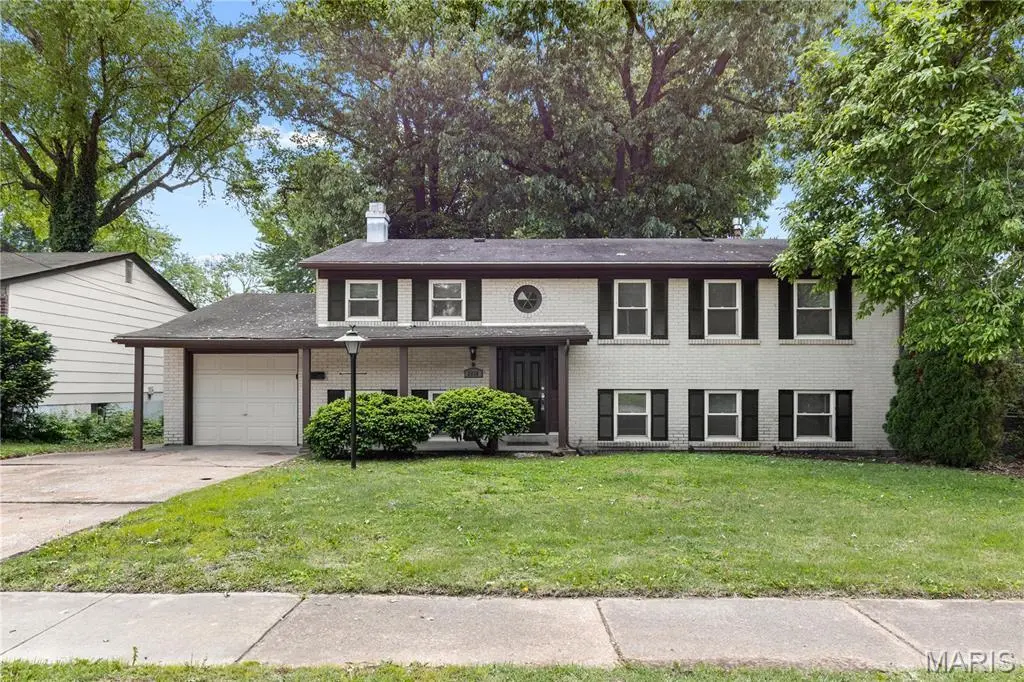
2010 E Humes Ln
Florissant, MO 63033
$199,900B
5 bd · 2.0 ba ·
1,092 sqft ·
Built 1967
· SingleFamily
· Pending
· 29 DOM
Cashflow @ list (25.0% down · 7.5%)
Estimated rent
$2,075/mo
Mortgage (P&I)
−$1,048
Tax + insurance
−$717
HOA
−$0
Vac / Maint / Mgmt
−$436
Net cashflow
$-125/mo
Annual
$-1,504/yr
Cap rate
8.30%
Cash-on-cash
7.18%
DSCR
1.32
1% rule
1.04%
Cash to close
$55,972
Investor read
- This is a 5-bed/2.0-bath single-family listed at $200k.
- At list price, monthly cash flow is $-125 ($-2k/yr) — negative.
- To cash-flow at today's rent, offer at most $178k (11.1% below list).
- Meets the 1% rule at list price ($2k rent vs $200k).
- It's been on market 29 days — a 2% lower offer ($197k) is reasonable based on typical stale-listing flexibility.
- Recommended offer: $178k (11.1% below list) — sets the bar for cash-flow.
- In year one you build about $21k of equity ($1k loan paydown + $20k appreciation (10.0% local appreciation)).
- Location reads 73/100 on livability (#82 in MO) — a middle-class / working-renter tenant base. Strengths: cost of living A+, housing A+, health & safety B+; Watch: crime C-, amenities D+, commute F.
- Ferguson-Florissant R-II (suburban): math 7% / reading 20% proficiency, ranked #311 of 324 in MO (top 96%) — low school quality limits family demand, transient renter base, plan for 1-2y turnover; 70% free/reduced lunch — lower-income household profile, screen leases tightly.
- Zoned schools: Wedgwood 6Th Grade Center (math 6% / reading 20%, grade F, #368 of 391 statewide, top 94%, 307 students, 99% FRL); Cross Keys Middle (math 5% / reading 10%, grade F, #379 of 391 statewide, top 97%, 625 students, 100% FRL); Mccluer North High (math 5% / reading 28%, grade F, #487 of 521 statewide, top 93%, 1,136 students, 100% FRL) — zoned schools average 99% FRL vs 70% district-wide (30 pts higher); higher-poverty schools than district average — tighter screening recommended.
- Watch-outs: flood insurance adds $460/mo.
- Market conditions: Rents rising fast (+7.5%/yr); 224 active listings in the ZIP; 920 units permitted in St. Louis County in 2024 (250 in 5+ unit buildings).
- 3 sale attempts since 12y ago with the ask held roughly flat each time — persistent listings suggest the price (not the market) is what's stuck; bring a comps-based counter.
- Current owner paid $122k; list at $200k implies a 63% gain — meaningful room to come down on a strong offer.
- By year 2, paydown + projected appreciation supports a ~$34k cash-out refi (75% LTV) — recoverable capital for the next deal without selling this one.
- Climate carrying-cost: in FEMA flood zone AE (mandatory federal flood insurance) — expect insurance premiums to compound above CPI over the hold.
- Cap rate 8.3% vs local median 6.2% in Florissant — top-decile yield for the area; either an underpriced asset or a hidden risk that comps aren't pricing in. Stress-test before assuming the spread holds.
- This rent runs 37% of the median local income ($67k/yr) — at the standard rent-burdened threshold; future hikes will face affordability resistance.
Questions for listing agent
- What do current leases actually rent for vs. the listed asking? Can we see a recent rent roll and the last 12 months of T-12 income?
- Built in 1967 — when were the roof, HVAC, electrical panel, plumbing, and water heater last replaced?
- What's the actual annual flood-insurance premium (NFIP or private), and is the property in a SFHA with mandatory coverage?
- Is there a deadline driving the sale (1031 exchange, divorce, estate, relocation)? That informs how much negotiation room exists.
- Schools are D-rated, which usually means shorter tenancies and higher turnover. Who's the typical renter profile here, and what's been the actual vacancy rate?
- What's the average days-on-market for RENTAL listings here right now (not sales)? A rising rental-DOM trend means longer vacancies and softer asking-rent achievability than the comps imply.
- What's the recent tenant-quality profile in this submarket — average credit score on applications, eviction rate, late-payment / NSF rate, and stable-employment percentage? A property-management company in the area should have these aggregated.
- How much new for-sale + rental construction is in the pipeline within 1–3 miles? Heavy new supply typically softens prices + rents 12–24 months out; constrained supply supports both.
CashFlowRE · CFR-NVJ1N86QH50WVV
· Data 5 days ago
cashflowre.app · 2026-05-29