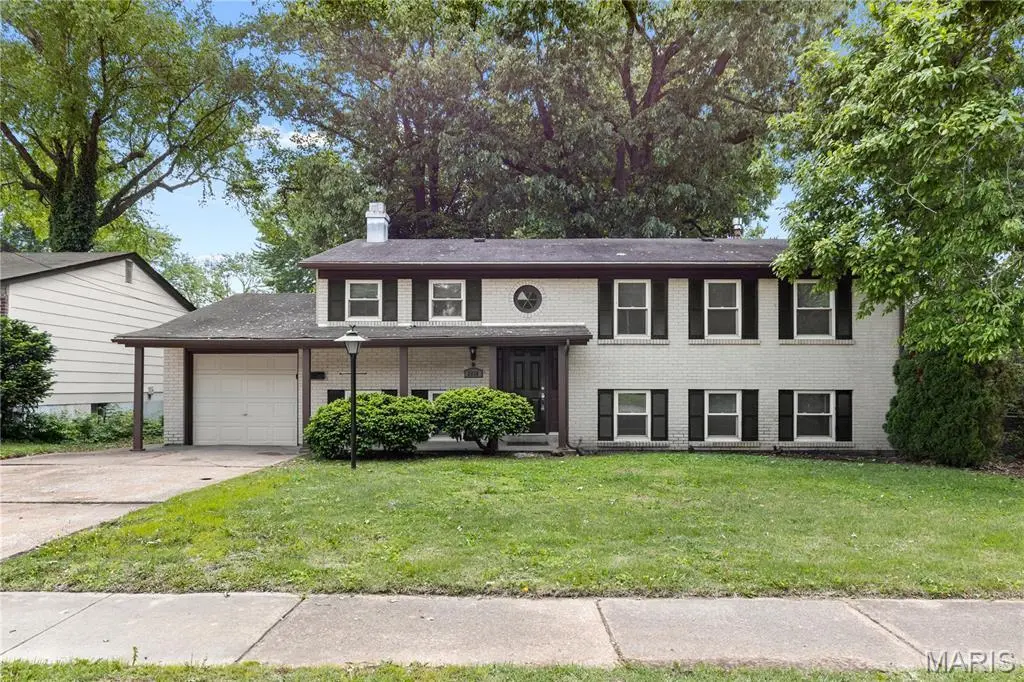
2010 E Humes Ln · Florissant, MO
Flood risk 5/10 · Moderate
- FEMA flood zone
- AE
- Chance of flooding over 30 yrs
- 0.24%
- Est. flood insurance / yr
- $2,026 – $9,024
Fire risk 1/10 · Minimal
- Est. fire insurance / yr
- $1,054 – $1,958
Heat risk 4/10 · Minor
- Hot days now (above 105°F)
- 7 days/yr
- Hot days in 30 yrs
- 21 days/yr
Wind risk 2/10 · Minimal
- Chance of severe wind over 30 yrs
- 1.0%
Air-quality risk 3/10 · Minor
- Unhealthy air days now
- 3 days/yr
- Unhealthy air days in 30 yrs
- 5 days/yr
Risk factors via First Street. Map © Google.
Why this score? — see what drove the B grade
The composite is a weighted blend of 9 inputs, each scored 0–100. Each bar is that input's sub-score; the figure is the points it added to the 100-point composite (weight × sub-score).
- Cash flow +22.5/30.0
- ARV discount +14.5/15.0
- Appreciation +10.0/10.0
- DSCR +7.2/10.0
- 1% rule +5.4/10.0
- Rent growth +4.4/5.0
- Livability +3.7/5.0
- Condition / age +2.5/5.0
- Schools +1.2/10.0
$199,900
🖨 Deal sheet (PDF) 📄 Offer letter ✓ Due diligence
Listing remarks MLS
A lovely 5 bedroom split foyer waiting just for you! This home features hardwood flooring, a woodburning fireplace right in time for these cool winter nights! A large kitchen with plenty of cabinet space a place for the chef of the family, nice size rooms, an immense basement with lots of space for a family area and extra sleeping areas. A fenced in backyard great for entertaining guest during the warm weather! Schedule a showing today!The property was built prior to 1978 and lead-based paint potentially exists.
Key facts
- 0.23 acre lot
- Garage
- Built 1967
Property features AI
Finance
- Other: Ownership: Private
- HOA & community: No association fees
Exterior
- Parking: Attached garage (garage faces front) with 1 garage space; Additional off-street parking
- Utilities: Public water; Public sewer; Electric service by Ameren; Cable available; electricity, natural gas, sewer and water connected
- Home design: Single-family residence (residential); Updated / remodeled condition; Multi/split levels; House structure type; Entry with front-facing garage
- Construction: Brick veneer, frame and vinyl siding exterior; Concrete perimeter foundation
- Exterior features: Covered front porch, deck and patio; Private backyard; Fenced yard with chain link, wood and privacy fencing; Located on a cul-de-sac, level lot, near public transit
Interior
- Kitchen: Dishwasher; Disposal; Microwave; Gas oven; Gas range; Refrigerator
- Bedrooms: 5 bedrooms total — 3 on the main level, 2 in the lower level
- Flooring: Ceramic tile; Hardwood
- Bathrooms: 2 full bathrooms — 1 full on the main level, 1 full in the lower level
- Heating & cooling: Forced air heating (natural gas); Central electric air conditioning
- Interior features: Eat-in kitchen; Pantry; Blinds; Insulated windows; 1 fireplace (wood-burning) serving the family/recreation room; Partially finished basement with walk-up access and sleeping area
- Laundry & utility: Laundry located in the lower level / basement; Gas water heater
Neighborhood map
What this means for you Summary
Snapshot
- This is a 5-bed/2.0-bath single-family listed at $200k.
Deal economics
- At list price, monthly cash flow is $-125 ($-2k/yr) — negative.
- To cash-flow at today's rent, offer at most $178k (11.1% below list).
- Meets the 1% rule at list price ($2k rent vs $200k).
- Recommended offer: $178k (11.1% below list) — sets the bar for cash-flow.
- Cap rate 8.3% vs local median 6.2% in Florissant — top-decile yield for the area; either an underpriced asset or a hidden risk that comps aren't pricing in. Stress-test before assuming the spread holds.
Location & tenants
- Location reads 73/100 on livability (#82 in MO) — a middle-class / working-renter tenant base. Strengths: cost of living A+, housing A+, health & safety B+; Watch: crime C-, amenities D+, commute F.
- Ferguson-Florissant R-II (suburban): math 7% / reading 20% proficiency, ranked #311 of 324 in MO (top 96%) — low school quality limits family demand, transient renter base, plan for 1-2y turnover; 70% free/reduced lunch — lower-income household profile, screen leases tightly.
- Zoned schools: Wedgwood 6Th Grade Center (math 6% / reading 20%, grade F, #368 of 391 statewide, top 94%, 307 students, 99% FRL); Cross Keys Middle (math 5% / reading 10%, grade F, #379 of 391 statewide, top 97%, 625 students, 100% FRL); Mccluer North High (math 5% / reading 28%, grade F, #487 of 521 statewide, top 93%, 1,136 students, 100% FRL) — zoned schools average 99% FRL vs 70% district-wide (30 pts higher); higher-poverty schools than district average — tighter screening recommended.
- Market conditions: Rents rising fast (+7.5%/yr); 224 active listings in the ZIP; 920 units permitted in St. Louis County in 2024 (250 in 5+ unit buildings).
- This rent runs 37% of the median local income ($67k/yr) — at the standard rent-burdened threshold; future hikes will face affordability resistance.
Forward outlook
- In year one you build about $21k of equity ($1k loan paydown + $20k appreciation (10.0% local appreciation)).
- By year 2, paydown + projected appreciation supports a ~$34k cash-out refi (75% LTV) — recoverable capital for the next deal without selling this one.
Negotiation context
- It's been on market 29 days — a 2% lower offer ($197k) is reasonable based on typical stale-listing flexibility.
- 3 sale attempts since 12y ago with the ask held roughly flat each time — persistent listings suggest the price (not the market) is what's stuck; bring a comps-based counter.
- Current owner paid $122k; list at $200k implies a 63% gain — meaningful room to come down on a strong offer.
Risks & watch-outs
- Watch-outs: flood insurance adds $460/mo.
- Climate carrying-cost: in FEMA flood zone AE (mandatory federal flood insurance) — expect insurance premiums to compound above CPI over the hold.
Questions for the listing agent
- What do current leases actually rent for vs. the listed asking? Can we see a recent rent roll and the last 12 months of T-12 income?
- Built in 1967 — when were the roof, HVAC, electrical panel, plumbing, and water heater last replaced?
- What's the actual annual flood-insurance premium (NFIP or private), and is the property in a SFHA with mandatory coverage?
- Is there a deadline driving the sale (1031 exchange, divorce, estate, relocation)? That informs how much negotiation room exists.
- Schools are D-rated, which usually means shorter tenancies and higher turnover. Who's the typical renter profile here, and what's been the actual vacancy rate?
- What's the average days-on-market for RENTAL listings here right now (not sales)? A rising rental-DOM trend means longer vacancies and softer asking-rent achievability than the comps imply.
- What's the recent tenant-quality profile in this submarket — average credit score on applications, eviction rate, late-payment / NSF rate, and stable-employment percentage? A property-management company in the area should have these aggregated.
- How much new for-sale + rental construction is in the pipeline within 1–3 miles? Heavy new supply typically softens prices + rents 12–24 months out; constrained supply supports both.
Investment metrics
- 1% rule
- 1.04% ✓
- Cap rate
- 8.30%
- Cash-on-cash
- 7.18%
- DSCR
- 1.32
- GRM
- 8.0
CMA / ARV
- ARV (median comp)
- $236,823
- List price
- $199,900
- Delta
- -15.59%
- Verdict
- UNDERPRICED
- Comps
- 20 within 1.0 mi
Show comp detail 7 sales within ~0.75 mi
| Address | Dist | Beds/Ba | Sqft | Sold | Price | $/sf | Match |
|---|---|---|---|---|---|---|---|
| 2265 Briarcrest Dr | 0.16mi | 4/2.0 (-1) | 1,092 (0%) | 3mo | $200,000 | $183 | 85 |
| 2190 Glenoro Dr | 0.29mi | 4/2.5 (-1) | 1,083 (-1%) | 3mo | $225,999 | $209 | 76 |
| 475 Moule Dr | 0.51mi | 4/1.5 (-1) | 1,114 (+2%) | 9mo | $160,000 | $144 | 58 |
| 1460 Fox Run Dr | 0.64mi | 4/2.0 (-1) | 1,050 (-4%) | 1mo | $169,900 | $162 | 58 |
| 1910 Apple Blossom Ct | 0.49mi | 4/2.0 (-1) | 1,174 (+8%) | 5mo | $240,000 | $204 | 56 |
| 605 Sherwood Dr | 0.74mi | 4/1.5 (-1) | 1,080 (-1%) | 8mo | $185,000 | $171 | 50 |
| 13 Saint Celeste Dr | 0.59mi | 4/1.0 (-1) | 1,180 (+8%) | 6mo | $129,900 | $110 | 45 |
Match score weights: distance 35% · size 25% · config 20% · recency 20%. Top-matched comps best support the ARV.
Projected returns pro-forma
10.0% appreciation · 7.51% rent growth · sell at horizon
- IRR
- 24.3%
- Equity multiple
- 2.98×
- Total profit
- $111,002
- Equity at exit
- $180,086
- IRR
- 23.0%
- Equity multiple
- 7.39×
- Total profit
- $357,620
- Equity at exit
- $388,362
Cash invested: $55,972 (down + closing). Projections, not guarantees.
Landlord ↔ Tenant lean methodology
- Overall (STATE)
- 81 Strongly Landlord-Friendly
- State Missouri
- 81 Strongly Landlord-Friendly · R+10
- County
- — inherits STATE
- City
- — inherits STATE
ZIP-level market 63033
- Home prices YoY
- 2.5%
- Rents YoY
- 7.5%
- Active inventory
- 224
- Price-to-rent
- 8.0×
Monthly cashflow live
- Estimated rent
- $2,075 medium interval (Pro) →
- Mortgage (P&I)
- −$1,048
- Tax from tax record
- −$173 /mo · $2,075/yr
- Insurance
- −$83
- Flood insurance flood zone
- −$460 /mo · $5,525/yr
- HOA
- −$0
- Vacancy / Maint / Mgmt
- −$436
- Net cashflow
- $-125
Break-even live
Sensitivity live
| Price | -10% $-12 | -5% $-69 | +0% $-125 | +5% $-182 | +10% $-238 |
|---|---|---|---|---|---|
| Rent | -10% $-289 | -5% $-207 | +0% $-125 | +5% $-43 | +10% $39 |
| Rate | -1.0pp $-25 | -0.5pp $-74 | base $-125 | +0.5pp $-177 | +1.0pp $-230 |
UW: 25.0% down · 7.5% · 30yr · 1.5% tax · 5.0% vac · 8.0% maint · 8.0% mgmt
Financing live
Cash to close
- Down payment
- $49,975
- Closing costs
- $5,997
- Reserves months
- —
- Total cash needed
- —
Loan-product check · same deal, 3 products live
Conventional
25% down · 7.5% · 30yr
- Down + closing
- —
- Monthly P&I
- —
- Monthly cashflow
- —
- DSCR
- —
- Eligible?
- —
Personal DTI + credit; lowest rate.
DSCR
20% down · 8.5% · 30yr
- Down + closing
- —
- Monthly P&I
- —
- Monthly cashflow
- —
- DSCR
- —
- Eligible?
- —
No personal income docs; deal must DSCR.
Hard money
10% down · 12.0% · 12mo
- Down + closing
- —
- Monthly P&I
- —
- Monthly cashflow
- —
- DSCR
- —
- Eligible?
- —
Short-term bridge; refi at stabilization.
Listing history 18 events
-
2026-06-18status $199,900 Pending 29 DOM
-
2026-06-17days on market $199,900 Active 29 DOM
-
2026-06-16days on market $199,900 Active 28 DOM
-
2026-06-15days on market $199,900 Active 27 DOM
-
2026-06-13days on market $199,900 Active 25 DOM
-
2026-06-13statusdays on market $199,900 Active 24 DOM
-
2026-06-07statusdays on market $199,900 Pending 22 DOM
-
2026-06-05days on market $199,900 Active 21 DOM
-
2026-06-03days on market $199,900 Active 20 DOM
-
2026-06-02days on market $199,900 Active 19 DOM
-
2026-06-01days on market $199,900 Active 18 DOM
-
2026-05-31days on market $199,900 Active 17 DOM
-
2026-05-14$210,000 Active 1348-char remark
-
2026-04-30historical $210,000 1348-char remark
-
2015-01-15soldstatus 517-char remark
Show marketing remark (517 chars)
A lovely 5 bedroom split foyer waiting just for you! This home features hardwood flooring, a woodburning fireplace right in time for these cool winter nights! A large kitchen with plenty of cabinet space a place for the chef of the family, nice size rooms, an immense basement with lots of space for a family area and extra sleeping areas. A fenced in backyard great for entertaining guest during the warm weather! Schedule a showing today!The property was built prior to 1978 and lead-based paint potentially exists.
-
2014-10-30$55,900 517-char remark
Show marketing remark (517 chars)
A lovely 5 bedroom split foyer waiting just for you! This home features hardwood flooring, a woodburning fireplace right in time for these cool winter nights! A large kitchen with plenty of cabinet space a place for the chef of the family, nice size rooms, an immense basement with lots of space for a family area and extra sleeping areas. A fenced in backyard great for entertaining guest during the warm weather! Schedule a showing today!The property was built prior to 1978 and lead-based paint potentially exists.
-
2009-07-09soldstatus $122,500
-
1992-07-30soldstatus
ⓘ Source: listings_history table (triggers on properties + properties_extension) + one-shot
backfill from property_details.listing_events for pre-trigger history.
Tax reassessment forecast MO · Resets to sale price
- Current annual tax
- $2,075 · $173/mo
- Projected year-2 tax
- $2,075 · $173/mo
- Expected delta
- $0/yr ($0/mo · 0.0%)
ⓘ Screening estimate from a state-policy table — verify with the county assessor before closing.
Climate risk First Street
- Flood 5/10 Major FEMA zone AE · 24% chance over 30 yrs
- Wildfire 1/10 Low
- Heat 4/10 Moderate 7 d/yr ≥105°F today · 21 d/yr by 30 yrs out
- Wind 2/10 Low 100% chance of damaging wind over 30 yrs
- Air quality 3/10 Moderate 3 unhealthy d/yr today · 5 by 30 yrs out
Nearby sold comps map
Loading sold comps map…
Walkable amenities ~0.75 mi
Loading nearby amenities…
Taxation est. · year 1
- Rental income
- $24,906
- − Mortgage interest
- −$11,198
- − Property taxes
- −$2,075
- − Insurance
- −$6,524
- − Repairs & maintenance
- −$1,992
- − Management
- −$1,992
- − Depreciation
- −$5,815
- Taxable loss
- −$4,692
- Est. tax savings @ 24.0%
- +$1,126
- After-tax cash flow
- $-378/yr
For passive investors: Depreciation is non-cash, so a rental often shows a tax loss while cash-flowing — sheltering income. Rental losses are passive: they offset passive income freely, and up to $25,000/yr can offset ordinary (W-2) income if you actively participate and your MAGI is under $100k (phasing out to $0 by $150k); unused losses carry forward. On sale, claimed depreciation is recaptured at up to 25%, and gains may owe capital-gains tax (a 1031 exchange can defer both). Figures are a year-1 estimate at your 24.0% rate — not tax advice; consult a CPA.
Schools (NCES district)
- District
- Ferguson-Florissant R-II
- NCES district ID
- 2912010
- Math proficiency
- 7% ▼ -9.00%
- Reading proficiency
- 20% ▼ -6.00%
- Median HH income
- $44,610
- Composite
- 11.96/100
- National rank
- #9666
- State rank
- #311 of 324 in MO
Livability — Florissant
- Score
- 73/100
- State rank
- #82
- US rank
- #5406
Category grades
Schools grade is shown separately in the Schools card above.
Census & demographics
- County
- Saint Louis County · 888,823 people
- City population
- 69,104
- Metro
- St. Louis, MO-IL
- Population (ZIP)
- 43,056
- Household income
- $66,776
- Rent vs Own
- Severe rent burden
- 1429.0
Population outlook (St. Louis County) Hauer SSP2
- Today (2025)
- 1,025,227 people
- By 2030
- 1,028,023 · +0.3%
- By 2040
- 1,020,940 · -0.4%
- By 2050
- 1,007,280 · -1.8%
- By 2075
- 987,277 · -3.7%
- By 2100
- 921,984 · -10.1%
Race, ethnicity, and origin ACS 2023
- Neighborhood character
- Predominantly Black (71%)
- Race & ethnicity
- Black 71% White 23% Two or more races 4% Hispanic / Latino 1%
- Common ancestry
- Romanian 1% Lithuanian 1% Italian 1%
- Foreign-born
- 3% · Canada, Vietnam
- Languages at home
- 95% English-only · Spanish 1% French/Haitian/Cajun 1%
Political lean MEDSL · St. Louis
- 2024 margin
- Strong D (+23.4) · D 60.8% · R 37.4% · Other 1.7%
- 2008→2024 swing
- +3.5pp toward D · 2008: 19.9pp · 2024: 23.4pp
- All cycles
- 2024: D+23.4 2020: D+24.0 2016: D+16.2 2012: D+13.7 2008: D+19.9
Not yet ingested
- Civics
- —
Market trends
- HPI YoY
- ▲ 13.78%
- Current HPI
- 570.6
- Rent YoY
- ▲ 7.51%
- Metro
- St. Louis, MO-IL
- State GDP YoY
- ▲ 1.84%
- F500 in state
- 20
Industry mix (Fortune 500 HQ in MO)
| Industry | F500 HQs | Revenue |
|---|---|---|
| Healthcare | 1 | $163B |
|
||
| Insurance | 1 | $21B |
|
||
| Industrial Technology | 1 | $17B |
|
||
| Retail | 1 | $16B |
|
||
| Industrial Distribution | 1 | $10B |
|
||
| Utilities | 1 | $9B |
|
||
Price history
+63.2% since first listed10 events — show timeline
- 2026-06-18 Pending — MARIS as Distributed by MLS Grid
- 2026-06-10 Relisted — MARIS as Distributed by MLS Grid
- 2026-06-05 Pending — MARIS as Distributed by MLS Grid
- 2026-05-26 Price Changed $199,900 MARIS as Distributed by MLS Grid
- 2026-05-14 Listed $210,000 MARIS as Distributed by MLS Grid
- 2026-04-30 Coming Soon $210,000 MARIS as Distributed by MLS Grid
- 2015-01-15 Sold (MLS) — MARIS as Distributed by MLS Grid
- 2014-10-30 Listed $55,900 MARIS as Distributed by MLS Grid
- 2009-07-09 Sold (Public Records) $122,500 Public Records
- 1992-07-30 Sold (Public Records) — Public Records
Property tax history
+2.1%/yrLatest (2022): $2,075 · +0.3% YoY. Source: county tax records.
Cash-flow waterfall
monthlySold comps — $/sqft
last 12 mo · ≤1 miLoading sold comps…