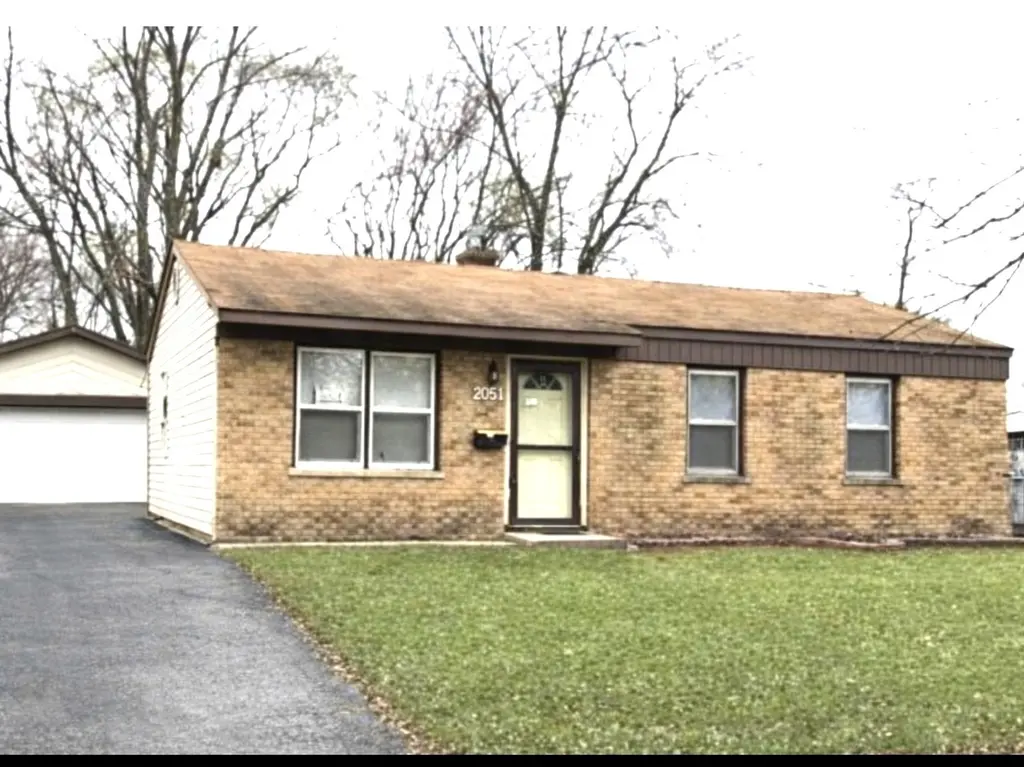
2051 217th St
Sauk Village, IL 60411
$169,900D
3 bd · 1.0 ba ·
925 sqft ·
Built 1960
· SingleFamily
· Active
· 6 DOM
Cashflow @ list (25.0% down · 7.5%)
Estimated rent
$1,786/mo
Mortgage (P&I)
−$891
Tax + insurance
−$302
HOA
−$0
Vac / Maint / Mgmt
−$375
Net cashflow
$218/mo
Annual
$2,614/yr
Cap rate
7.83%
Cash-on-cash
5.50%
DSCR
1.24
1% rule
1.05%
Cash to close
$47,572
Investor read
- This is a 3-bed/1.0-bath single-family listed at $170k.
- At list price, monthly cash flow is $218 ($3k/yr) — positive.
- The deal already cash-flows at list — no discount required.
- Meets the 1% rule at list price ($2k rent vs $170k).
- Only 6 days on market — expect competitive offers; lowballing is unlikely to land.
- Local home prices are declining (-3.0%/yr); year-one equity from $1k of loan paydown is wiped out by about $5k of value loss. Plan a longer hold.
- Location reads 66/100 on livability (#546 in IL) — a middle-class / working-renter tenant base. Strengths: cost of living A+, housing A+; Watch: crime C-, health & safety D+, commute D.
- Bloom Twp Hsd 206 (suburban): math 8% / reading 9% proficiency, ranked #591 of 620 in IL (top 95%) — low school quality limits family demand, transient renter base, plan for 1-2y turnover.
- Zoned schools: Wagoner Elem (476 students, 0% FRL); Rickover Jr High School (math 2% / reading 5%, grade F, #652 of 665 statewide, top 98%, 370 students, 0% FRL); Bloom Trail High School (math 12% / reading 12%, grade F, #511 of 693 statewide, top 75%, 1,227 students, 0% FRL).
- Market conditions: Rents rising fast (+6.5%/yr); 224 active listings in the ZIP; 6 comparable units currently listed for rent nearby; rentals at typical pace (median 21d on market — plan ~3-4 weeks tenant-placement turnaround); 6,272 units permitted in Cook County in 2024 (4,658 in 5+ unit buildings).
- 8 sale attempts since 11y ago with the ask held roughly flat each time — persistent listings suggest the price (not the market) is what's stuck; bring a comps-based counter.
- Current owner paid $23k; list at $170k implies a 628% gain — meaningful room to come down on a strong offer.
- At projected returns (-3.0% appreciation + 6.5% rent growth), your $48k cash investment doubles in ~10 years — after that, you're playing with house money.
- This rent runs 35% of the median local income ($62k/yr) — at the standard rent-burdened threshold; future hikes will face affordability resistance.
Questions for listing agent
- Built in 1960 — when were the roof, HVAC, electrical panel, plumbing, and water heater last replaced?
- Is there a deadline driving the sale (1031 exchange, divorce, estate, relocation)? That informs how much negotiation room exists.
- Schools are F-rated, which usually means shorter tenancies and higher turnover. Who's the typical renter profile here, and what's been the actual vacancy rate?
- The area grade is low — what's the realistic commute time and amenity access for the typical tenant pool here? Any planned neighborhood developments (good or bad) we should know about?
- What's the average days-on-market for RENTAL listings here right now (not sales)? A rising rental-DOM trend means longer vacancies and softer asking-rent achievability than the comps imply.
- What's the recent tenant-quality profile in this submarket — average credit score on applications, eviction rate, late-payment / NSF rate, and stable-employment percentage? A property-management company in the area should have these aggregated.
- How much new for-sale + rental construction is in the pipeline within 1–3 miles? Heavy new supply typically softens prices + rents 12–24 months out; constrained supply supports both.
CashFlowRE · CFR-NVN0VY1FXGQV4Z
· Data 21 h ago
cashflowre.app · 2026-05-29