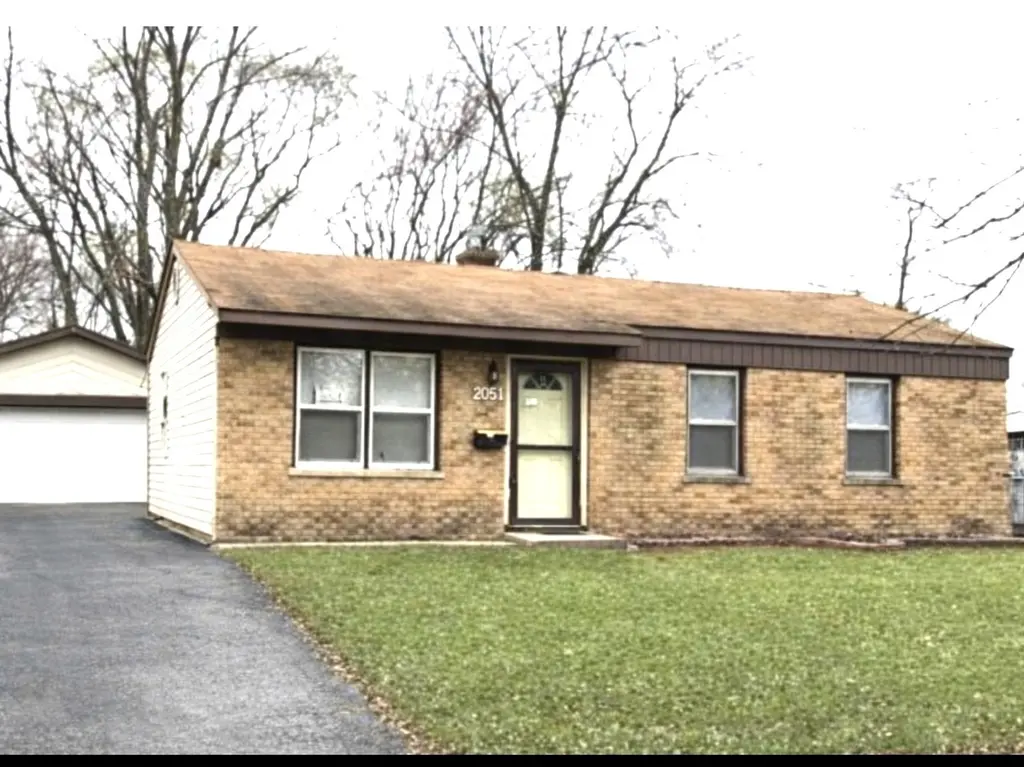
2051 217th St · Sauk Village, IL
Flood risk 1/10 · Minimal
- FEMA flood zone
- X (unshaded)
- Chance of flooding over 30 yrs
- 0.0%
- Est. flood insurance / yr
- $473 – $860
Fire risk 1/10 · Minimal
- Est. fire insurance / yr
- $804 – $1,492
Heat risk 3/10 · Minor
- Hot days now (above 101°F)
- 7 days/yr
- Hot days in 30 yrs
- 15 days/yr
Wind risk 2/10 · Minimal
- Chance of severe wind over 30 yrs
- 1.0%
Air-quality risk 2/10 · Minimal
- Unhealthy air days now
- 2 days/yr
- Unhealthy air days in 30 yrs
- 2 days/yr
Risk factors via First Street. Map © Google.
Why this score? — see what drove the D grade
The composite is a weighted blend of 9 inputs, each scored 0–100. Each bar is that input's sub-score; the figure is the points it added to the 100-point composite (weight × sub-score).
- Cash flow +20.3/30.0
- DSCR +6.4/10.0
- 1% rule +5.5/10.0
- Rent growth +4.1/5.0
- Livability +3.3/5.0
- Condition / age +2.5/5.0
- Schools +0.7/10.0
- ARV discount +0.0/15.0
- Appreciation +0.0/10.0
$169,900
🖨 Deal sheet (PDF) 📄 Offer letter ✓ Due diligence
Listing remarks
Updated 3-bedroom ranch featuring wood-look ceramic tile flooring throughout and a spacious living room/dining room combination with an eat-in kitchen. The kitchen offers custom wood cabinets with granite countertops, a designer ceramic backsplash, and stainless steel appliances. The bathroom has been updated with ceramic tile, a soaking tub, and quality fixtures. A long side drive leads to a 2.5-car detached garage and a large backyard. Well-maintained home with great curb appeal and a landscaped lot - move-in ready.
Key facts
- Custom wood cabinets
- Soaking tub
- Granite countertops
Tags
Neighborhood map
What this means for you Summary
Snapshot
- This is a 3-bed/1.0-bath single-family listed at $170k.
Deal economics
- At list price, monthly cash flow is $218 ($3k/yr) — positive.
- The deal already cash-flows at list — no discount required.
- Meets the 1% rule at list price ($2k rent vs $170k).
Location & tenants
- Location reads 66/100 on livability (#546 in IL) — a middle-class / working-renter tenant base. Strengths: cost of living A+, housing A+; Watch: crime C-, health & safety D+, commute D.
- Bloom Twp Hsd 206 (suburban): math 8% / reading 9% proficiency, ranked #591 of 620 in IL (top 95%) — low school quality limits family demand, transient renter base, plan for 1-2y turnover.
- Zoned schools: Wagoner Elem (476 students, 0% FRL); Rickover Jr High School (math 2% / reading 5%, grade F, #652 of 665 statewide, top 98%, 370 students, 0% FRL); Bloom Trail High School (math 12% / reading 12%, grade F, #511 of 693 statewide, top 75%, 1,227 students, 0% FRL).
- Market conditions: Rents rising fast (+6.5%/yr); 224 active listings in the ZIP; 6 comparable units currently listed for rent nearby; rentals at typical pace (median 21d on market — plan ~3-4 weeks tenant-placement turnaround); 6,272 units permitted in Cook County in 2024 (4,658 in 5+ unit buildings).
- This rent runs 35% of the median local income ($62k/yr) — at the standard rent-burdened threshold; future hikes will face affordability resistance.
Forward outlook
- Local home prices are declining (-3.0%/yr); year-one equity from $1k of loan paydown is wiped out by about $5k of value loss. Plan a longer hold.
- At projected returns (-3.0% appreciation + 6.5% rent growth), your $48k cash investment doubles in ~10 years — after that, you're playing with house money.
Negotiation context
- Only 6 days on market — expect competitive offers; lowballing is unlikely to land.
- 8 sale attempts since 11y ago with the ask held roughly flat each time — persistent listings suggest the price (not the market) is what's stuck; bring a comps-based counter.
- Current owner paid $23k; list at $170k implies a 628% gain — meaningful room to come down on a strong offer.
Questions for the listing agent
- Built in 1960 — when were the roof, HVAC, electrical panel, plumbing, and water heater last replaced?
- Is there a deadline driving the sale (1031 exchange, divorce, estate, relocation)? That informs how much negotiation room exists.
- Schools are F-rated, which usually means shorter tenancies and higher turnover. Who's the typical renter profile here, and what's been the actual vacancy rate?
- The area grade is low — what's the realistic commute time and amenity access for the typical tenant pool here? Any planned neighborhood developments (good or bad) we should know about?
- What's the average days-on-market for RENTAL listings here right now (not sales)? A rising rental-DOM trend means longer vacancies and softer asking-rent achievability than the comps imply.
- What's the recent tenant-quality profile in this submarket — average credit score on applications, eviction rate, late-payment / NSF rate, and stable-employment percentage? A property-management company in the area should have these aggregated.
- How much new for-sale + rental construction is in the pipeline within 1–3 miles? Heavy new supply typically softens prices + rents 12–24 months out; constrained supply supports both.
Investment metrics
- 1% rule
- 1.05% ✓
- Cap rate
- 7.83%
- Cash-on-cash
- 5.50%
- DSCR
- 1.24
- GRM
- 7.9
CMA / ARV
- ARV (on-the-fly)
- $134,125
- Comps found
- 12
Show comp detail 12 sales within ~0.75 mi
| Address | Dist | Beds/Ba | Sqft | Sold | Price | $/sf | Match |
|---|---|---|---|---|---|---|---|
| 2133 216th St | 0.13mi | 3/1.0 | 913 (-1%) | 1mo | $152,000 | $166 | 91 |
| 2059 216th St | 0.09mi | 3/1.0 | 913 (-1%) | 4mo | $167,000 | $183 | 91 |
| 1914 215th Pl | 0.20mi | 3/1.0 | 906 (-2%) | 1mo | $160,000 | $177 | 86 |
| 2171 221st St | 0.44mi | 3/1.0 | 925 (0%) | 5mo | $80,000 | $86 | 75 |
| 2402 Sauk Trl | 0.37mi | 3/1.0 | 894 (-3%) | 3mo | $85,000 | $95 | 75 |
| 21706 Olivia Ave | 0.31mi | 3/1.0 | 1,000 (+8%) | 1mo | $85,000 | $85 | 71 |
| 2065 219th Pl | 0.28mi | 3/1.0 | 1,000 (+8%) | 4mo | $145,000 | $145 | 70 |
| 21604 Clyde Ave | 0.18mi | 3/1.0 | 1,020 (+10%) | 5mo | $67,500 | $66 | 70 |
| 2053 222nd Pl | 0.58mi | 3/1.0 | 906 (-2%) | 5mo | $122,000 | $135 | 65 |
| 22336 Merrill Ave | 0.75mi | 3/1.0 | 913 (-1%) | 2mo | $139,900 | $153 | 62 |
| 2522 Orion Ave | 0.56mi | 2/1.0 (-1) | 894 (-3%) | 6mo | $61,790 | $69 | 59 |
| 1835 223rd St | 0.68mi | 3/1.0 | 1,000 (+8%) | 2mo | $169,900 | $170 | 53 |
Match score weights: distance 35% · size 25% · config 20% · recency 20%. Top-matched comps best support the ARV.
Projected returns pro-forma
-3.0% appreciation · 6.48% rent growth · sell at horizon
- IRR
- -3.9%
- Equity multiple
- 0.85×
- Total profit
- $-7,144
- Equity at exit
- $25,333
- IRR
- 9.5%
- Equity multiple
- 1.85×
- Total profit
- $40,334
- Equity at exit
- $14,690
Cash invested: $47,572 (down + closing). Projections, not guarantees.
Landlord ↔ Tenant lean methodology
- Overall (STATE)
- 43 Moderately Tenant-Leaning
- State Illinois
- 43 Moderately Tenant-Leaning · D+7
- County
- — inherits STATE
- City
- — inherits STATE
ZIP-level market 60411
- Home prices YoY
- -33.9%
- Rents YoY
- 6.5%
- Active inventory
- 224
- Price-to-rent
- 7.9×
Monthly cashflow live
- Estimated rent
- $1,786 high interval (Pro) →
- Mortgage (P&I)
- −$891
- Tax from tax record
- −$231 /mo · $2,776/yr
- Insurance
- −$71
- HOA
- −$0
- Vacancy / Maint / Mgmt
- −$375
- Net cashflow
- $218
Break-even live
Sensitivity live
| Price | -10% $314 | -5% $266 | +0% $218 | +5% $170 | +10% $122 |
|---|---|---|---|---|---|
| Rent | -10% $77 | -5% $147 | +0% $218 | +5% $288 | +10% $359 |
| Rate | -1.0pp $303 | -0.5pp $261 | base $218 | +0.5pp $174 | +1.0pp $129 |
UW: 25.0% down · 7.5% · 30yr · 1.5% tax · 5.0% vac · 8.0% maint · 8.0% mgmt
Financing live
Cash to close
- Down payment
- $42,475
- Closing costs
- $5,097
- Reserves months
- —
- Total cash needed
- —
Loan-product check · same deal, 3 products live
Conventional
25% down · 7.5% · 30yr
- Down + closing
- —
- Monthly P&I
- —
- Monthly cashflow
- —
- DSCR
- —
- Eligible?
- —
Personal DTI + credit; lowest rate.
DSCR
20% down · 8.5% · 30yr
- Down + closing
- —
- Monthly P&I
- —
- Monthly cashflow
- —
- DSCR
- —
- Eligible?
- —
No personal income docs; deal must DSCR.
Hard money
10% down · 12.0% · 12mo
- Down + closing
- —
- Monthly P&I
- —
- Monthly cashflow
- —
- DSCR
- —
- Eligible?
- —
Short-term bridge; refi at stabilization.
Rent comps 6 comps
| Address | Beds | Baths | Sqft | Rent | $/sqft | DOM | Units | Dist |
|---|---|---|---|---|---|---|---|---|
| 21538 Gailine Ave Chicago Heights, IL | 3.0 | 1.0 | 1031 | $1,600 | $1.55 | 4d | 1 | 0.25mi |
| 2236 220th St Sauk Village, IL | 3.0 | 1.0 | 1008 | $1,800 | $1.79 | 26d | 1 | 0.40mi |
| 22332 Clyde Ave Sauk Village, IL | 3.0 | 1.0 | 925 | $1,800 | $1.95 | 26d | 1 | 0.75mi |
| 22340 Chappel Ave Sauk Village, IL | 3.0 | 1.0 | 1100 | $1,800 | $1.64 | 20d | 1 | 0.78mi |
| 2241 Astor St Unit Labs Sauk Village, IL | 2.0 | 2.0 | 1000 | $1,650 | $1.65 | 0d | 1 | 0.80mi |
| 1154 Barry Ln Sauk Village, IL | 2.0 | 2.0 | 960 | $1,550 | $1.61 | 0d | 1 | 0.81mi |
Listing history 35 events
-
2026-06-21days on market $169,900 Active 6 DOM
-
2026-06-18days on market $169,900 Active 3 DOM
-
2026-06-17days on market $169,900 Active 2 DOM
-
2026-06-15pricedays on market $169,900 Active 1 DOM
-
2026-06-15days on market $176,900 Active 20 DOM
-
2026-06-13days on market $176,900 Active 18 DOM
-
2026-06-13days on market $176,900 Active 17 DOM
-
2026-06-09days on market $176,900 Active 14 DOM
-
2026-06-08days on market $176,900 Active 13 DOM
-
2026-06-07days on market $176,900 Active 12 DOM
-
2026-06-04days on market $176,900 Active 9 DOM
-
2026-06-03days on market $176,900 Active 8 DOM
-
2026-06-02days on market $176,900 Active 7 DOM
-
2026-06-01days on market $176,900 Active 6 DOM
-
2026-05-31days on market $176,900 Active 5 DOM
-
2026-05-26$176,900 Active
-
2026-05-06historical
-
2026-04-24Active
-
2026-04-24historical
-
2026-03-06historical $1,750
-
2026-03-05Active
-
2025-12-06$1,750
-
2024-09-20historical $1,700
-
2024-09-07price $1,700
-
2024-05-04$1,800
-
2016-09-15soldstatus $23,350 Closed Sale
-
2016-05-20price $20,000
-
2016-05-20status Pending
-
2015-09-21status Reactivated
-
2015-07-13status Pending
-
2015-05-23status Reactivated
-
2015-02-16status Pending
-
2015-01-20$35,000 New
-
2005-03-30soldstatus $80,000
-
1989-01-17soldstatus $39,900
ⓘ Source: listings_history table (triggers on properties + properties_extension) + one-shot
backfill from property_details.listing_events for pre-trigger history.
Tax reassessment forecast IL · Partial reset (capped growth)
- Current annual tax
- $2,776 · $231/mo
- Projected year-2 tax
- $3,316 · $276/mo
- Expected delta
- +$540/yr (+$45/mo · 19.5%)
ⓘ Screening estimate from a state-policy table — verify with the county assessor before closing.
Climate risk First Street
- Flood 1/10 Low FEMA zone X (unshaded) · 0% chance over 30 yrs
- Wildfire 1/10 Low
- Heat 3/10 Moderate 7 d/yr ≥101°F today · 15 d/yr by 30 yrs out
- Wind 2/10 Low 100% chance of damaging wind over 30 yrs
- Air quality 2/10 Low 2 unhealthy d/yr today · 2 by 30 yrs out
Nearby sold comps map
Loading sold comps map…
Walkable amenities ~0.75 mi
Loading nearby amenities…
Taxation est. · year 1
- Rental income
- $21,433
- − Mortgage interest
- −$9,517
- − Property taxes
- −$2,776
- − Insurance
- −$850
- − Repairs & maintenance
- −$1,715
- − Management
- −$1,715
- − Depreciation
- −$4,943
- Taxable loss
- −$82
- Est. tax savings @ 24.0%
- +$20
- After-tax cash flow
- $2,634/yr
For passive investors: Depreciation is non-cash, so a rental often shows a tax loss while cash-flowing — sheltering income. Rental losses are passive: they offset passive income freely, and up to $25,000/yr can offset ordinary (W-2) income if you actively participate and your MAGI is under $100k (phasing out to $0 by $150k); unused losses carry forward. On sale, claimed depreciation is recaptured at up to 25%, and gains may owe capital-gains tax (a 1031 exchange can defer both). Figures are a year-1 estimate at your 24.0% rate — not tax advice; consult a CPA.
Schools (NCES district)
- District
- Bloom Twp Hsd 206
- NCES district ID
- 1706420
- Math proficiency
- 8% ▼ -3.00%
- Reading proficiency
- 9% ▼ -8.00%
- Median HH income
- $39,795
- Composite
- 7.4/100
- National rank
- #9952
- State rank
- #591 of 620 in IL
Livability — Sauk Village
- Score
- 66/100
- State rank
- #546
- US rank
- #11370
Category grades
Schools grade is shown separately in the Schools card above.
Census & demographics
- Census place
- Sauk Village, IL
- County
- Cook County · 4,486,803 people
- Metro
- Chicago-Naperville-Elgin, IL-IN-WI
- Population (ZIP)
- 52,175
- Household income
- $62,073
- Rent vs Own
- Severe rent burden
- 1714.0
Population outlook (Cook County) Hauer SSP2
- Today (2025)
- 5,347,519 people
- By 2030
- 5,357,703 · +0.2%
- By 2040
- 5,324,924 · -0.4%
- By 2050
- 5,230,762 · -2.2%
- By 2075
- 4,785,735 · -10.5%
- By 2100
- 4,188,836 · -21.7%
Race, ethnicity, and origin ACS 2023
- Neighborhood character
- Diverse neighborhood (Simpson 0.66)
- Race & ethnicity
- Black 49% Hispanic / Latino 26% White 19% Two or more races 11%
- Hispanic origin (detail)
- Mexican 22% Puerto Rican 2%
- Common ancestry
- Romanian 4% Portuguese 1% Lithuanian 1%
- Foreign-born
- 12% · Canada
- Languages at home
- 76% English-only · Spanish 21% Russian/Polish/Slavic 1% Other Indo-European 1%
Political lean MEDSL · Cook
- 2024 margin
- Solid D (+42.0) · D 70.4% · R 28.4% · Other 1.2%
- 2008→2024 swing
- -11.4pp toward R · 2008: 53.4pp · 2024: 42.0pp
- All cycles
- 2024: D+42.0 2020: D+50.3 2016: D+53.0 2012: D+49.4 2008: D+53.4
Not yet ingested
- Civics
- —
Market trends
- HPI YoY
- ▼ -108.75%
- Current HPI
- 212.4058
- Rent YoY
- ▲ 6.48%
- Metro
- Chicago-Naperville-Elgin, IL-IN-WI
- State GDP YoY
- ▲ 1.59%
- F500 in state
- 60
Industry mix (Fortune 500 HQ in IL)
| Industry | F500 HQs | Revenue |
|---|---|---|
| Insurance | 4 | $201B |
|
||
| Consumer Goods | 4 | $87B |
|
||
| Industrial Machinery | 3 | $64B |
|
||
| Healthcare | 2 | $55B |
|
||
| Retail / Pharmacy | 1 | $148B |
|
||
| Agriculture / Food | 1 | $86B |
|
||
Price history
+343.4% since first listed20 events — show timeline
- 2026-05-26 Listed $176,900 MRED as Distributed by MLS Grid
- 2026-05-06 Listing Removed — MRED as Distributed by MLS Grid
- 2026-04-24 Listing Removed — MRED as Distributed by MLS Grid
- 2026-04-24 Listed — MRED as Distributed by MLS Grid
- 2026-03-06 Rental Removed $1,750 MRED
- 2026-03-05 Listed — MRED as Distributed by MLS Grid
- 2025-12-06 Listed for Rent $1,750 MRED
- 2024-09-20 Rental Removed $1,700 MRED
- 2024-09-07 Price Changed $1,700 MRED
- 2024-05-04 Listed for Rent $1,800 MRED
- 2016-09-15 Sold (MLS) $23,350 MRED as Distributed by MLS Grid
- 2016-05-20 Price Changed $20,000 MRED as Distributed by MLS Grid
- 2016-05-20 Pending — MRED as Distributed by MLS Grid
- 2015-09-21 Relisted — MRED as Distributed by MLS Grid
- 2015-07-13 Pending — MRED as Distributed by MLS Grid
- 2015-05-23 Relisted — MRED as Distributed by MLS Grid
- 2015-02-16 Pending — MRED as Distributed by MLS Grid
- 2015-01-20 Listed $35,000 MRED as Distributed by MLS Grid
- 2005-03-30 Sold (Public Records) $80,000 Public Records
- 1989-01-17 Sold (Public Records) $39,900 Public Records
Property tax history
+1.1%/yrLatest (2023): $2,776 · +20.8% YoY. Source: county tax records.
Cash-flow waterfall
monthlySold comps — $/sqft
last 12 mo · ≤1 miLoading sold comps…