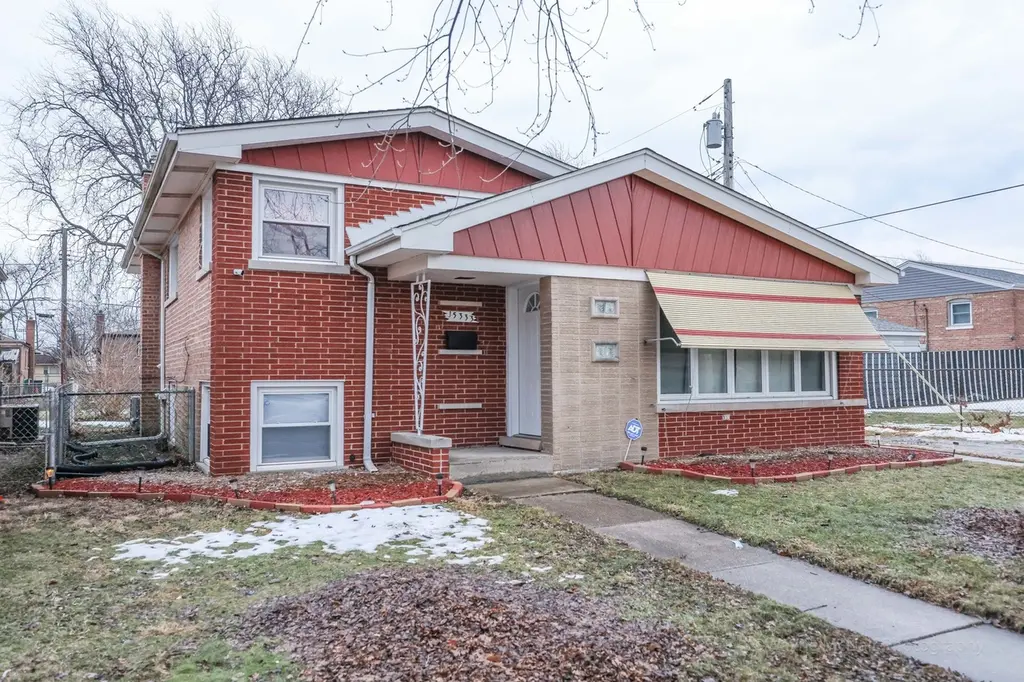
15333 Grant St
Dolton, IL 60419
$240,000D-
3 bd · 2.5 ba ·
1,195 sqft ·
Built 1961
· SingleFamily
· Active
· 43 DOM
Cashflow @ list (25.0% down · 7.5%)
Estimated rent
$2,627/mo
Mortgage (P&I)
−$1,259
Tax + insurance
−$674
HOA
−$0
Vac / Maint / Mgmt
−$552
Net cashflow
$143/mo
Annual
$1,711/yr
Cap rate
7.01%
Cash-on-cash
2.55%
DSCR
1.11
1% rule
1.09%
Cash to close
$67,200
Investor read
- This is a 3-bed/2.5-bath single-family listed at $240k.
- At list price, monthly cash flow is $143 ($2k/yr) — positive.
- The deal already cash-flows at list — no discount required.
- Meets the 1% rule at list price ($3k rent vs $240k).
- It's been on market 43 days — a 3% lower offer ($233k) is reasonable based on typical stale-listing flexibility.
- Recommended offer: $233k (3.0% below list) — sets the bar for market timing.
- Local home prices are declining (-3.0%/yr); year-one equity from $2k of loan paydown is wiped out by about $7k of value loss. Plan a longer hold.
- Location reads 74/100 on livability (#263 in IL, #4,883 nationally) — a middle-class / working-renter tenant base. Strengths: commute A+, cost of living A+, housing A+; Watch: employment C-, health & safety C-, schools F.
- Thornton Twp Hsd 205 (suburban): math 7% / reading 8% proficiency, ranked #594 of 620 in IL (top 96%) — low school quality limits family demand, transient renter base, plan for 1-2y turnover.
- Watch-outs: property tax is 2.9% of price.
- Market conditions: Rents rising fast (+9.7%/yr); 130 active listings in the ZIP; 14 comparable units currently listed for rent nearby; rentals at typical pace (median 20d on market — plan ~3-4 weeks tenant-placement turnaround); 6,272 units permitted in Cook County in 2024 (4,658 in 5+ unit buildings).
- 9 sale attempts since 6y ago with the ask held roughly flat each time — persistent listings suggest the price (not the market) is what's stuck; bring a comps-based counter.
- Current owner paid $170k; 41% above their basis — modest negotiation headroom, anchor on the comps not their cost.
- At projected returns (-3.0% appreciation + 8.0% rent growth), your $67k cash investment doubles in ~10 years — after that, you're playing with house money.
- Cap rate 7.0% vs local median 9.3% in Dolton — below-typical yield; the buyer is paying a premium for something (appreciation thesis, condition, location) that the cap rate doesn't capture.
- At $2,627/mo this rent would consume 54% of the median local household income ($58k/yr) (locally 919% of renters already pay >50% of income on rent) — very limited rent-growth headroom before tenants either downsize or default.
Questions for listing agent
- It's been on market 43 days. Have you received any prior offers? Is the seller open to a 3% concession, seller financing, or rate buy-down credit?
- Built in 1961 — when were the roof, HVAC, electrical panel, plumbing, and water heater last replaced?
- Property tax is high relative to price — has the assessment been appealed recently, and will the sale trigger a re-assessment?
- Is there a deadline driving the sale (1031 exchange, divorce, estate, relocation)? That informs how much negotiation room exists.
- Schools are F-rated, which usually means shorter tenancies and higher turnover. Who's the typical renter profile here, and what's been the actual vacancy rate?
- Crime grade is D in this area — have there been break-ins, vandalism, or insurance claims at this property in the last 3 years? What carrier currently insures it and at what premium?
- The area grade is low — what's the realistic commute time and amenity access for the typical tenant pool here? Any planned neighborhood developments (good or bad) we should know about?
- What's the average days-on-market for RENTAL listings here right now (not sales)? A rising rental-DOM trend means longer vacancies and softer asking-rent achievability than the comps imply.
CashFlowRE · CFR-NX1BYXF67AMA8R
· Data 2 days ago
cashflowre.app · 2026-05-29