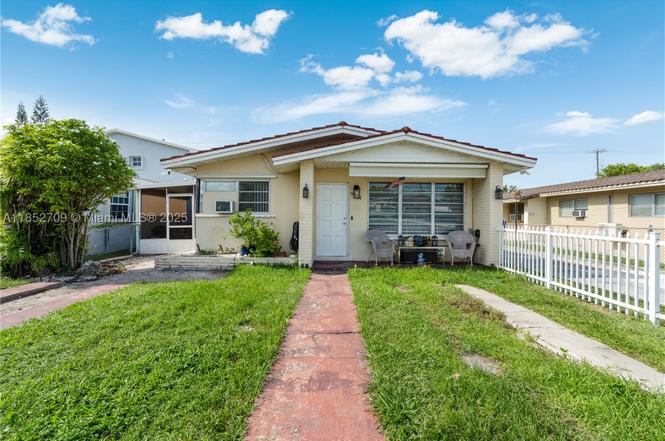
9311 SW 37th St
Westchester, FL 33165
$799,000D-
4 bd · 2.0 ba ·
2,106 sqft ·
Built 1963
· MultiFamily
· Active
· 317 DOM
Cashflow @ list (25.0% down · 7.5%)
Estimated rent
$6,195/mo
Mortgage (P&I)
−$4,190
Tax + insurance
−$907
HOA
−$0
Vac / Maint / Mgmt
−$1,301
Net cashflow
$-203/mo
Annual
$-2,438/yr
Cap rate
5.99%
Cash-on-cash
-1.09%
DSCR
0.95
1% rule
0.78%
Cash to close
$223,720
Investor read
- This is a 2 × 2-bed/?-bath units multifamily listed at $799k.
- At list price, monthly cash flow is $-203 ($-2k/yr) — negative. Per door: $-102/mo.
- To cash-flow at today's rent, offer at most $763k (4.5% below list).
- To meet the 1% rule (rent ≥ 1% of price), the offer needs to be $620k (22.5% below list).
- It's been on market 317 days — a 12% lower offer ($703k) is reasonable based on typical stale-listing flexibility.
- Recommended offer: $620k (22.5% below list) — sets the bar for 1% rule.
- Local home prices are declining (-3.0%/yr); year-one equity from $6k of loan paydown is wiped out by about $24k of value loss. Plan a longer hold.
- Location reads 85/100 on livability (#26 in FL, #589 nationally) — a professional / high-income tenant draw. Strengths: schools A+, crime A+, health & safety A+; Watch: cost of living D.
- Miami-Dade (suburban): math 45% / reading 54% proficiency, ranked #40 of 73 in FL (top 55%) — families likely to look elsewhere, expect single-tenant / working-renter base with shorter leases; 64% free/reduced lunch — lower-income household profile, screen leases tightly.
- Market conditions: Rents flat; 169 active listings in the ZIP; 40 comparable units currently listed for rent nearby; rentals at typical pace (median 25d on market — plan ~3-4 weeks tenant-placement turnaround); solid renter incomes; 10,051 units permitted in Miami-Dade County in 2024 (7,758 in 5+ unit buildings).
- Miami-Dade County population projected at +28% by 2050 — long-run rental-demand tailwind backs the buy-and-hold thesis.
- Current owner paid $34k; list at $799k implies a 2216% gain — meaningful room to come down on a strong offer.
- Climate carrying-cost: severe wind risk, 99% chance of damaging wind over 30y; extreme-heat days projected 7→30/yr by 2055 (HVAC capex compounding) — expect insurance premiums to compound above CPI over the hold.
- Cap rate 6.0% vs local median 3.4% in Westchester — top-decile yield for the area; either an underpriced asset or a hidden risk that comps aren't pricing in. Stress-test before assuming the spread holds.
- At $6,195/mo this rent would consume 87% of the median local household income ($85k/yr) (locally 1869% of renters already pay >50% of income on rent) — very limited rent-growth headroom before tenants either downsize or default.
Questions for listing agent
- What do current leases actually rent for vs. the listed asking? Can we see a recent rent roll and the last 12 months of T-12 income?
- It's been on market 317 days. Have you received any prior offers? Is the seller open to a 22% concession, seller financing, or rate buy-down credit?
- Can we see the unit-by-unit rent roll, current vacancy, and any below-market leases? What's the average tenancy length?
- What capital expenditures (roof, boiler, parking lot, exteriors) have been made in the last 5 years, and what's planned in the next 2?
- Built in 1963 — when were the roof, HVAC, electrical panel, plumbing, and water heater last replaced?
- Why hasn't it sold? Are there any deal-killer items the seller is aware of (foundation, flood, title, zoning, code violations)?
- Is there a deadline driving the sale (1031 exchange, divorce, estate, relocation)? That informs how much negotiation room exists.
- Schools are A-rated — typically a magnet for longer-tenancy family renters. What's the average tenant stay here, and is there a school-zone premium baked into asking?
CashFlowRE · CFR-NX2CFS7Z6YY0YV
· Data 2 days ago
cashflowre.app · 2026-05-29