 Duplex
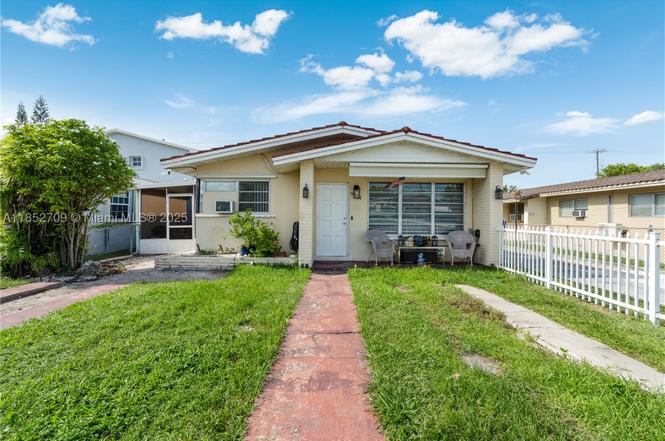
9311 SW 37th St · Westchester, FL
Flood risk 1/10 · Minimal
- FEMA flood zone
- X (unshaded)
- Chance of flooding over 30 yrs
- 0.0%
- Est. flood insurance / yr
- $507 – $1,088
Fire risk 1/10 · Minimal
- Est. fire insurance / yr
- $947 – $1,759
Heat risk 10/10 · Severe
- Hot days now (above 105°F)
- 7 days/yr
- Hot days in 30 yrs
- 30 days/yr
Wind risk 10/10 · Severe
- Chance of severe wind over 30 yrs
- 99.0%
Air-quality risk 2/10 · Minimal
- Unhealthy air days now
- 1 days/yr
- Unhealthy air days in 30 yrs
- 1 days/yr
Risk factors via First Street. Map © Google.
Why this score? — see what drove the D- grade
The composite is a weighted blend of 9 inputs, each scored 0–100. Each bar is that input's sub-score; the figure is the points it added to the 100-point composite (weight × sub-score).
- Cash flow +11.9/30.0
- ARV discount +6.2/15.0
- Schools +4.2/10.0
- Livability +4.2/5.0
- DSCR +3.5/10.0
- 1% rule +2.8/10.0
- Rent growth +2.5/5.0
- Condition / age +2.5/5.0
- Appreciation +0.0/10.0
$799,000
🖨 Deal sheet 📄 Offer letter ✓ Due diligence
Multi-family units
County records classify this as Multi-Family (2-4 Unit). Listing-text estimate: 2 units. confirmed
Listing remarks
Must-See Duplex in the Heart of Westchester This unique and centrally located duplex offers incredible potential in the highly desirable Westchester area — just minutes from supermarkets, schools, and public transportation. Property Features: Main Unit: 1 bed / 1 bath Second Unit: Can be configured as a 1 bed / 1 bath or a 2 bed / 1 bath Third Unit: 1 bed / 1 bath, summer kitchen and plenty of parking Impact windows and doors Second and third units fully updated Important Note: The property has open permits and existing code violations that will be assumed by the buyer. Great opportunity for investors or buyers looking to customize and capitalize on a multi-unit property in a
Key facts
- Must-see duplex
- Fully updated units
- Plenty of parking
Tags
Property features AI
Finance
- Financial info: Rent details vary by unit; one unit listed with $1,000 monthly and noted as month‑to‑month; Trash collection included in rent for some units
- HOA & community: Laundry facilities available (community)
Exterior
- Parking: Total of 4 parking spaces; Other parking configurations noted (varies by unit)
- Security: Fire sprinklers in some units
- Utilities: Cable available; Septic tank
- Home design: Single‑story building
- Construction: Block construction; Concrete roof
- Exterior features: Balcony; Enclosed porch / screened porch; Patio; Outdoor grill; Fence; Shed
Interior
- Kitchen: Ranges; Refrigerators; Dishwasher (in some units); Microwave (in some units); Garbage disposal (in some units)
- Bedrooms: Three 1‑bedroom units; Two 2‑bedroom units
- Flooring: Terrazzo; Tile
- Bathrooms: Units include full and half bath configurations (some units have 1 full bath; 2‑bed units include 1 full and 1 half bath)
- Heating & cooling: Central air; Ceiling fans; Wall/window units
- Interior features: Terrazzo and tile flooring
- Laundry & utility: On‑site laundry facilities (community); Dryer listed as an appliance in some units; Electric meters; Gas tank (leased) in some units; Fuse box / electrical panel
Neighborhood map
What this means for you Summary
Snapshot
- This is a 2 × 2-bed/?-bath units multifamily listed at $799k.
Deal economics
- At list price, monthly cash flow is $-203 ($-2k/yr) — negative. Per door: $-102/mo.
- To cash-flow at today's rent, offer at most $763k (4.5% below list).
- To meet the 1% rule (rent ≥ 1% of price), the offer needs to be $620k (22.5% below list).
- Recommended offer: $620k (22.5% below list) — sets the bar for 1% rule.
- Cap rate 6.0% vs local median 3.4% in Westchester — top-decile yield for the area; either an underpriced asset or a hidden risk that comps aren't pricing in. Stress-test before assuming the spread holds.
Location & tenants
- Location reads 85/100 on livability (#26 in FL, #589 nationally) — a professional / high-income tenant draw. Strengths: schools A+, crime A+, health & safety A+; Watch: cost of living D.
- Miami-Dade (suburban): math 45% / reading 54% proficiency, ranked #40 of 73 in FL (top 55%) — families likely to look elsewhere, expect single-tenant / working-renter base with shorter leases; 64% free/reduced lunch — lower-income household profile, screen leases tightly.
- Market conditions: Rents flat; 169 active listings in the ZIP; 40 comparable units currently listed for rent nearby; rentals at typical pace (median 24d on market — plan ~3-4 weeks tenant-placement turnaround); solid renter incomes; 10,051 units permitted in Miami-Dade County in 2024 (7,758 in 5+ unit buildings).
- At $6,195/mo this rent would consume 87% of the median local household income ($85k/yr) (locally 1869% of renters already pay >50% of income on rent) — very limited rent-growth headroom before tenants either downsize or default.
Forward outlook
- Local home prices are declining (-3.0%/yr); year-one equity from $6k of loan paydown is wiped out by about $24k of value loss. Plan a longer hold.
- Miami-Dade County population projected at +28% by 2050 — long-run rental-demand tailwind backs the buy-and-hold thesis.
Negotiation context
- It's been on market 317 days — a 12% lower offer ($703k) is reasonable based on typical stale-listing flexibility.
- Current owner paid $34k; list at $799k implies a 2216% gain — meaningful room to come down on a strong offer.
Risks & watch-outs
- Climate carrying-cost: severe wind risk, 99% chance of damaging wind over 30y; extreme-heat days projected 7→30/yr by 2055 (HVAC capex compounding) — expect insurance premiums to compound above CPI over the hold.
Questions for the listing agent
- What do current leases actually rent for vs. the listed asking? Can we see a recent rent roll and the last 12 months of T-12 income?
- It's been on market 317 days. Have you received any prior offers? Is the seller open to a 22% concession, seller financing, or rate buy-down credit?
- Can we see the unit-by-unit rent roll, current vacancy, and any below-market leases? What's the average tenancy length?
- What capital expenditures (roof, boiler, parking lot, exteriors) have been made in the last 5 years, and what's planned in the next 2?
- Built in 1963 — when were the roof, HVAC, electrical panel, plumbing, and water heater last replaced?
- Why hasn't it sold? Are there any deal-killer items the seller is aware of (foundation, flood, title, zoning, code violations)?
- Is there a deadline driving the sale (1031 exchange, divorce, estate, relocation)? That informs how much negotiation room exists.
- Schools are A-rated — typically a magnet for longer-tenancy family renters. What's the average tenant stay here, and is there a school-zone premium baked into asking?
- The area grade is low — what's the realistic commute time and amenity access for the typical tenant pool here? Any planned neighborhood developments (good or bad) we should know about?
- What's the average days-on-market for RENTAL listings here right now (not sales)? A rising rental-DOM trend means longer vacancies and softer asking-rent achievability than the comps imply.
- What's the recent tenant-quality profile in this submarket — average credit score on applications, eviction rate, late-payment / NSF rate, and stable-employment percentage? A property-management company in the area should have these aggregated.
- How much new apartment / multifamily construction is in the pipeline within 1–3 miles? Heavy new supply (>2% of stock underway) typically softens rents 12–24 months out; light construction supports rent growth.
Investment metrics
- 1% rule
- 0.78% ✗
- Cap rate
- 5.99%
- Cash-on-cash
- -1.09%
- DSCR
- 0.95
- GRM
- 10.7
CMA / ARV
- ARV (on-the-fly)
- $777,114
- Comps found
- 1
Show comp detail 1 sale within ~0.75 mi
| Address | Dist | Beds/Ba | Sqft | Sold | Price | $/sf | Match |
|---|---|---|---|---|---|---|---|
| 8961 SW 34th St | 0.37mi | 4/3.0 | 2,301 (+9%) | 24mo | $849,500 | $369 | 43 |
Match score weights: distance 35% · size 25% · config 20% · recency 20%. Top-matched comps best support the ARV.
Projected returns pro-forma
-3.0% appreciation · 0.07% rent growth · sell at horizon
- IRR
- -21.2%
- Equity multiple
- 0.28×
- Total profit
- $-160,324
- Equity at exit
- $119,133
- IRR
- -22.6%
- Equity multiple
- -0.01×
- Total profit
- $-225,618
- Equity at exit
- $69,083
Cash invested: $223,720 (down + closing). Projections, not guarantees.
Landlord ↔ Tenant lean methodology
- Overall (STATE)
- 87 Strongly Landlord-Friendly
- State Florida
- 87 Strongly Landlord-Friendly · R+3
- County
- — inherits STATE
- City
- — inherits STATE
ZIP-level market 33165
- Rents YoY
- 0.1%
- Active inventory
- 169
- Price-to-rent
- 21.5×
Monthly cashflow live
- Estimated rent
- $6,195 high interval (Pro) →
- Mortgage (P&I)
- −$4,190
- Tax from tax record
- −$574 /mo · $6,891/yr
- Insurance
- −$333
- HOA
- −$0
- Vacancy / Maint / Mgmt
- −$1,301
- Net cashflow
- $-203
Break-even live
2-unit breakdown (identical units grouped — click to expand)
| Units | Beds | Baths | Est. rent |
|---|---|---|---|
| 2× units | 2 | — | $6,194 |
| #1 | 2 | — | $3,097 |
| #2 | 2 | — | $3,097 |
| Total (2 units) | $6,195 | ||
UW: 25.0% down · 7.5% · 30yr · 1.5% tax · 5.0% vac · 8.0% maint · 8.0% mgmt
Financing live
Cash to close
- Down payment
- $199,750
- Closing costs
- $23,970
- Reserves months
- —
- Total cash needed
- —
Loan-product check · same deal, 3 products live
Conventional
25% down · 7.5% · 30yr
- Down + closing
- —
- Monthly P&I
- —
- Monthly cashflow
- —
- DSCR
- —
- Eligible?
- —
Personal DTI + credit; lowest rate.
DSCR
20% down · 8.5% · 30yr
- Down + closing
- —
- Monthly P&I
- —
- Monthly cashflow
- —
- DSCR
- —
- Eligible?
- —
No personal income docs; deal must DSCR.
Hard money
10% down · 12.0% · 12mo
- Down + closing
- —
- Monthly P&I
- —
- Monthly cashflow
- —
- DSCR
- —
- Eligible?
- —
Short-term bridge; refi at stabilization.
Rent comps 40 comps
| Address | Beds | Baths | Sqft | Rent | $/sqft | DOM | Units | Dist |
|---|---|---|---|---|---|---|---|---|
| 9228 SW 37th St Miami, FL | 3.0 | 2.0 | 2284 | $3,700 | $1.62 | 5d | 1 | 0.11mi |
| 9228 SW 37th St Unit 9228 Miami, FL | 3.0 | 2.0 | 2284 | $3,700 | $1.62 | 24d | 1 | 0.11mi |
| 3221 SW 93rd Pl Miami, FL | 3.0 | 2.0 | 2088 | $3,700 | $1.77 | 24d | 1 | 0.24mi |
| 9699 SW 35th St Miami, FL | 3.0 | 2.0 | 1700 | $4,350 | $2.56 | 3d | 1 | 0.36mi |
| 8877 SW 36th St Miami, FL | 5.0 | 3.0 | 2719 | $4,750 | $1.75 | 24d | 1 | 0.42mi |
| 3030 SW 96th Ave Miami, FL | 3.0 | 2.0 | 1740 | $5,000 | $2.87 | 24d | 1 | 0.47mi |
| 8774 SW 36th St Miami, FL | 3.0 | 2.0 | 1600 | $3,750 | $2.34 | 24d | 1 | 0.55mi |
| 3731 SW 87th Pl Miami, FL | 3.0 | 2.0 | 1440 | $3,600 | $2.50 | 18d | 1 | 0.55mi |
| 8773 SW 36th St Miami, FL | 3.0 | 3.0 | 1500 | $3,750 | $2.50 | 24d | 1 | 0.56mi |
| 3855 SW 87th Pl Miami, FL | 4.0 | 2.0 | 1740 | $3,850 | $2.21 | 24d | 1 | 0.57mi |
| 9315 SW 44th St Miami, FL | 4.0 | 2.0 | 1602 | $5,500 | $3.43 | 22d | 1 | 0.59mi |
| 2780 SW 90th Ave Miami, FL | 3.0 | 2.0 | 1470 | $3,500 | $2.38 | 7d | 1 | 0.62mi |
| 9901 SW 35th Ter Miami, FL | 4.0 | 3.0 | 2104 | $5,600 | $2.66 | 24d | 1 | 0.62mi |
| 8980 SW 44th St Miami, FL | 3.0 | 2.0 | 2203 | $4,300 | $1.95 | 24d | 1 | 0.67mi |
| 2645 SW 90th Ave Unit 2645 Miami, FL | 3.0 | 2.0 | 2151 | $3,500 | $1.63 | 24d | 1 | 0.72mi |
| 4242 SW 98th Ave Unit 4242 Miami, FL | 4.0 | 2.0 | 1692 | $4,200 | $2.48 | 24d | 1 | 0.73mi |
| 9320 SW 46th Ter #9320 Miami, FL | 3.0 | 2.0 | 1904 | $3,500 | $1.84 | 24d | 1 | 0.76mi |
| 8581 SW 29th St Miami, FL | 4.0 | 3.0 | 1749 | $4,500 | $2.57 | 1d | 1 | 0.81mi |
| 8581 SW 29th St Miami, FL | 4.0 | 3.0 | 1749 | $4,500 | $2.57 | 24d | 1 | 0.81mi |
| 4865 SW 94th Ave Miami, FL | 3.0 | 2.0 | 2200 | $4,400 | $2.00 | 24d | 1 | 0.89mi |
| 4161 SW 102nd Ave Miami, FL | 4.0 | 3.0 | 1806 | $4,000 | $2.21 | 12d | 1 | 0.94mi |
| 4161 SW 102nd Ave Miami, FL | 4.0 | 3.0 | 1806 | $4,000 | $2.21 | 24d | 1 | 0.94mi |
| 9910 SW 23rd St Unit n/a Miami, FL | 3.0 | 2.5 | 1905 | $4,000 | $2.10 | 24d | 1 | 1.02mi |
| 10320 SW 38th Ter Miami, FL | 3.0 | 2.5 | 2677 | $4,000 | $1.49 | 22d | 1 | 1.02mi |
| 4732 SW 87th Ct Unit 4732 Miami, FL | 3.0 | 2.0 | 1418 | $4,000 | $2.82 | 3d | 1 | 1.03mi |
| 4732 SW 87th Ct Unit 4732 Miami, FL | 3.0 | 2.0 | 1418 | $4,100 | $2.89 | 18d | 1 | 1.03mi |
| 8421 SW 27th Ter Miami, FL | 3.0 | 2.0 | 2214 | $3,850 | $1.74 | 24d | 1 | 1.04mi |
| 8421 SW 27th Ter Miami, FL | 3.0 | 2.0 | 2214 | $3,999 | $1.81 | 7d | 1 | 1.04mi |
| 3100 SW 103rd Ct Miami, FL | 3.0 | 2.0 | 2139 | $3,500 | $1.64 | 24d | 1 | 1.08mi |
| 8225 SW 39th St Unit 1373700P Miami, FL | 3.0 | 2.0 | 1496 | $5,693 | $3.81 | 2d | 1 | 1.11mi |
| 3420 SW 104th Ave Miami, FL | 3.0 | 2.0 | 2033 | $3,400 | $1.67 | 24d | 1 | 1.13mi |
| 2134 SW 99th Ave Unit 2134 Miami, FL | 3.0 | 2.0 | 1761 | $4,500 | $2.56 | 3d | 1 | 1.13mi |
| 9780 SW 19th St Miami, FL | 4.0 | 3.5 | 2239 | $7,695 | $3.44 | 3d | 1 | 1.19mi |
| 9780 SW 19th St Miami, FL | 4.0 | 3.5 | 2239 | $7,695 | $3.44 | 4d | 1 | 1.19mi |
| 8245 SW 43rd St Miami, FL | 3.0 | 2.0 | 1620 | $4,000 | $2.47 | 24d | 1 | 1.19mi |
| 8310 SW 45th St Miami, FL | 3.0 | 2.0 | 1800 | $5,000 | $2.78 | 7d | 1 | 1.20mi |
| 8310 SW 45th St Miami, FL | 3.0 | 2.0 | 1800 | $5,000 | $2.78 | 24d | 1 | 1.20mi |
| 8201 SW 42nd St Miami, FL | 4.0 | 3.0 | 1749 | $5,500 | $3.14 | 2d | 1 | 1.20mi |
| 9999 SW 21st St Miami, FL | 3.0 | 2.0 | 2180 | $5,000 | $2.29 | 24d | 1 | 1.21mi |
| 1621 SW 93rd Ct Unit 1537764P Miami, FL | 3.0 | 3.0 | 1894 | $6,679 | $3.53 | 15d | 1 | 1.24mi |
Listing history 16 events
-
2026-06-18days on market $799,000 Active 317 DOM
-
2026-06-17days on market $799,000 Active 316 DOM
-
2026-06-16days on market $799,000 Active 315 DOM
-
2026-06-15days on market $799,000 Active 314 DOM
-
2026-06-13days on market $799,000 Active 312 DOM
-
2026-06-09days on market $799,000 Active 308 DOM
-
2026-06-08days on market $799,000 Active 307 DOM
-
2026-06-08days on market $799,000 Active 306 DOM
-
2026-06-04days on market $799,000 Active 303 DOM
-
2026-06-03days on market $799,000 Active 302 DOM
-
2026-06-02days on market $799,000 Active 301 DOM
-
2026-06-01days on market $799,000 Active 300 DOM
-
2026-05-31days on market $799,000 Active 299 DOM
-
2025-10-17price $799,000
-
2025-08-05$849,000 Active
-
1971-06-01soldstatus $34,500
ⓘ Source: listings_history table (triggers on properties + properties_extension) + one-shot
backfill from property_details.listing_events for pre-trigger history.
Tax reassessment forecast FL · Resets to sale price
- Current annual tax
- $6,891 · $574/mo
- Projected year-2 tax
- $6,891 · $574/mo
- Expected delta
- $0/yr ($0/mo · -0.0%)
ⓘ Screening estimate from a state-policy table — verify with the county assessor before closing.
Climate risk First Street
- Flood 1/10 Low FEMA zone X (unshaded) · 0% chance over 30 yrs
- Wildfire 1/10 Low
- Heat 10/10 Extreme 7 d/yr ≥105°F today · 30 d/yr by 30 yrs out
- Wind 10/10 Extreme 99% chance of damaging wind over 30 yrs
- Air quality 2/10 Low 1 unhealthy d/yr today · 1 by 30 yrs out
Nearby sold comps map
Loading sold comps map…
Walkable amenities ~0.75 mi
Loading nearby amenities…
Taxation est. · year 1
- Rental income
- $74,340
- − Mortgage interest
- −$44,756
- − Property taxes
- −$6,891
- − Insurance
- −$3,995
- − Repairs & maintenance
- −$5,947
- − Management
- −$5,947
- − Depreciation
- −$23,244
- Taxable loss
- −$16,441
- Est. tax savings @ 24.0%
- +$3,946
- After-tax cash flow
- $1,508/yr
For passive investors: Depreciation is non-cash, so a rental often shows a tax loss while cash-flowing — sheltering income. Rental losses are passive: they offset passive income freely, and up to $25,000/yr can offset ordinary (W-2) income if you actively participate and your MAGI is under $100k (phasing out to $0 by $150k); unused losses carry forward. On sale, claimed depreciation is recaptured at up to 25%, and gains may owe capital-gains tax (a 1031 exchange can defer both). Figures are a year-1 estimate at your 24.0% rate — not tax advice; consult a CPA.
Schools (NCES district)
- District
- Miami-Dade
- NCES district ID
- 1200390
- Math proficiency
- 45% ▼ -16.00%
- Reading proficiency
- 54% ▼ -5.00%
- Median HH income
- $43,928
- Composite
- 41.76/100
- National rank
- #3397
- State rank
- #40 of 73 in FL
Livability — Westchester
- Score
- 85/100
- State rank
- #26
- US rank
- #589
Category grades
Schools grade is shown separately in the Schools card above.
Census & demographics
- Census place
- Westchester, FL
- County
- Miami-Dade County · 2,697,751 people
- City population
- 50,471
- Metro
- Miami-Fort Lauderdale-Pompano Beach, FL
- Population (ZIP)
- 48,817
- Household income
- $85,200
- Rent vs Own
- Severe rent burden
- 1869.0
Population outlook (Miami-Dade County) Hauer SSP2
- Today (2025)
- 3,126,439 people
- By 2030
- 3,325,765 · +6.4%
- By 2040
- 3,697,561 · +18.3%
- By 2050
- 4,012,134 · +28.3%
- By 2075
- 4,605,612 · +47.3%
- By 2100
- 4,866,598 · +55.7%
Race, ethnicity, and origin ACS 2023
- Neighborhood character
- Predominantly Hispanic (92%)
- Race & ethnicity
- Hispanic / Latino 92% Two or more races 54% White 7%
- Hispanic origin (detail)
- Mexican 2% Puerto Rican 3% Cuban 70% Dominican 1% Salvadoran 1%
- Common ancestry
- Lithuanian 1%
- Foreign-born
- 65% · Canada, Jamaica, Dominican Republic
- Languages at home
- 10% English-only · Spanish 89% Other Indo-European 1%
Political lean MEDSL · Miami-Dade
- 2024 margin
- R (+11.4) · D 43.9% · R 55.4%
- 2008→2024 swing
- -27.6pp toward R · 2008: 16.1pp · 2024: -11.4pp
- All cycles
- 2024: R+11.4 2020: D+7.3 2016: D+29.6 2012: D+23.7 2008: D+16.1
Not yet ingested
- Civics
- —
Market trends
- HPI YoY
- ▼ -642.07%
- Current HPI
- 447.0023
- Rent YoY
- ▲ 0.07%
- Metro
- Miami-Fort Lauderdale-Pompano Beach, FL
- State GDP YoY
- ▲ 3.28%
- F500 in state
- 36
Industry mix (Fortune 500 HQ in FL)
| Industry | F500 HQs | Revenue |
|---|---|---|
| Industrial Technology | 2 | $29B |
|
||
| Insurance | 2 | $17B |
|
||
| Retail | 1 | $60B |
|
||
| Technology Distribution | 1 | $58B |
|
||
| Homebuilding | 1 | $35B |
|
||
| Technology Manufacturing | 1 | $35B |
|
||
Price history
+2215.9% since first listed3 events — show timeline
- 2025-10-17 Price Changed $799,000 MARMLS
- 2025-08-05 Listed $849,000 MARMLS
- 1971-06-01 Sold (Public Records) $34,500 Public Records
Property tax history
+3.6%/yrLatest (2025): $6,891 · +4.0% YoY. Source: county tax records.
Cash-flow waterfall
monthlySold comps — $/sqft
last 12 mo · ≤1 miLoading sold comps…