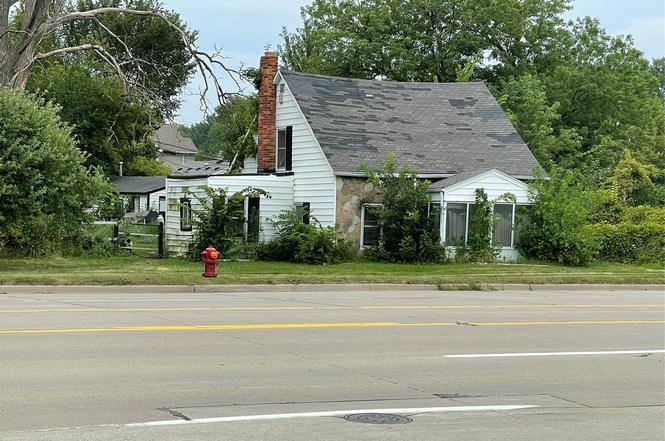
1828 John R Rd
Troy, MI 48083
$150,000B
3 bd · 1.0 ba ·
1,010 sqft ·
Built 1936
· SingleFamily
· Pending
· 264 DOM
Cashflow @ list (25.0% down · 7.5%)
Estimated rent
$2,047/mo
Mortgage (P&I)
−$787
Tax + insurance
−$239
HOA
−$0
Vac / Maint / Mgmt
−$430
Net cashflow
$591/mo
Annual
$7,089/yr
Cap rate
11.02%
Cash-on-cash
16.88%
DSCR
1.75
1% rule
1.36%
Cash to close
$42,000
Investor read
- This is a 3-bed/1.0-bath single-family listed at $150k.
- At list price, monthly cash flow is $591 ($7k/yr) — positive.
- The deal already cash-flows at list — no discount required.
- Meets the 1% rule at list price ($2k rent vs $150k).
- It's been on market 264 days — a 12% lower offer ($132k) is reasonable based on typical stale-listing flexibility.
- Recommended offer: $132k (12.0% below list) — sets the bar for market timing.
- Local home prices are declining (-3.0%/yr); year-one equity from $1k of loan paydown is wiped out by about $4k of value loss. Plan a longer hold.
- Location reads 78/100 on livability (#113 in MI, #2,684 nationally) — a middle-class / working-renter tenant base. Strengths: employment A+, housing A+, crime A; Watch: health & safety D+, amenities F, commute F.
- Warren Consolidated Schools (urban): math 18% / reading 39% proficiency, ranked #373 of 540 in MI (top 69%) — low school quality limits family demand, transient renter base, plan for 1-2y turnover.
- Zoned schools: Susick Elementary School (math 27% / reading 35%, grade F, #852 of 1,397 statewide, top 61%, 382 students, 69% FRL); Grissom Middle School (math 11% / reading 36%, grade F, #399 of 493 statewide, top 81%, 697 students, 84% FRL); Sterling Heights Senior Hs (math 17% / reading 47%, grade F, #405 of 713 statewide, top 59%, 1,389 students, 76% FRL) — zoned schools average 76% FRL vs 48% district-wide (28 pts higher); higher-poverty schools than district average — tighter screening recommended.
- Watch-outs: built in 1936 — expect roof / HVAC / electrical / plumbing capex.
- Market conditions: Rents soft (-0.6%/yr); 94 active listings in the ZIP; 14 comparable units currently listed for rent nearby; rentals at typical pace (median 24d on market — plan ~3-4 weeks tenant-placement turnaround); solid renter incomes; 2,614 units permitted in Oakland County in 2024 (721 in 5+ unit buildings).
- Oakland County population projected at +10% by 2050 — modest demand growth; plan on rents tracking national, not racing it.
- 8 sale attempts with the ask held roughly flat each time — persistent listings suggest the price (not the market) is what's stuck; bring a comps-based counter.
- At projected returns (-3.0% appreciation + 0.0% rent growth), your $42k cash investment doubles in ~10 years — after that, you're playing with house money.
- Climate carrying-cost: major flood risk — expect insurance premiums to compound above CPI over the hold.
- Cap rate 11.0% vs local median 3.6% in Troy — top-decile yield for the area; either an underpriced asset or a hidden risk that comps aren't pricing in. Stress-test before assuming the spread holds.
Questions for listing agent
- It's been on market 264 days. Have you received any prior offers? Is the seller open to a 12% concession, seller financing, or rate buy-down credit?
- Built in 1936 — when were the roof, HVAC, electrical panel, plumbing, and water heater last replaced?
- Why hasn't it sold? Are there any deal-killer items the seller is aware of (foundation, flood, title, zoning, code violations)?
- Is there a deadline driving the sale (1031 exchange, divorce, estate, relocation)? That informs how much negotiation room exists.
- Schools are A-rated — typically a magnet for longer-tenancy family renters. What's the average tenant stay here, and is there a school-zone premium baked into asking?
- What's the average days-on-market for RENTAL listings here right now (not sales)? A rising rental-DOM trend means longer vacancies and softer asking-rent achievability than the comps imply.
- What's the recent tenant-quality profile in this submarket — average credit score on applications, eviction rate, late-payment / NSF rate, and stable-employment percentage? A property-management company in the area should have these aggregated.
- How much new for-sale + rental construction is in the pipeline within 1–3 miles? Heavy new supply typically softens prices + rents 12–24 months out; constrained supply supports both.
CashFlowRE · CFR-NXE9AZ23NRSANZ
· Data 4 weeks ago
cashflowre.app · 2026-05-29