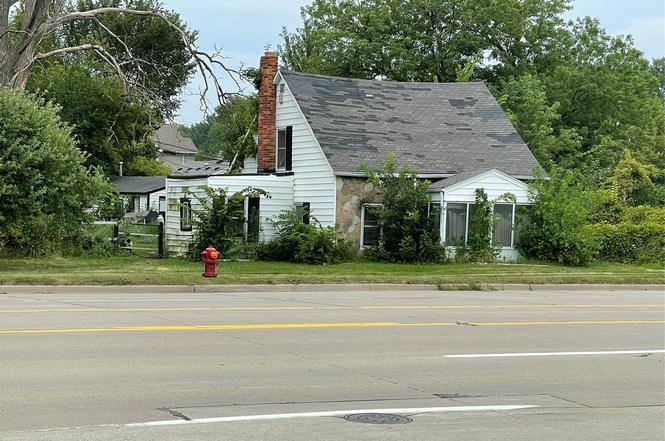
1828 John R Rd · Troy, MI
Flood risk 6/10 · Moderate
- FEMA flood zone
- X (unshaded)
- Chance of flooding over 30 yrs
- 0.98%
- Est. flood insurance / yr
- $507 – $1,088
Fire risk 1/10 · Minimal
- Est. fire insurance / yr
- $784 – $1,456
Heat risk 3/10 · Minor
- Hot days now (above 97°F)
- 7 days/yr
- Hot days in 30 yrs
- 15 days/yr
Wind risk 2/10 · Minimal
- Chance of severe wind over 30 yrs
- —
Air-quality risk 3/10 · Minor
- Unhealthy air days now
- 3 days/yr
- Unhealthy air days in 30 yrs
- 4 days/yr
Risk factors via First Street. Map © Google.
Why this score? — see what drove the B grade
The composite is a weighted blend of 9 inputs, each scored 0–100. Each bar is that input's sub-score; the figure is the points it added to the 100-point composite (weight × sub-score).
- Cash flow +30.0/30.0
- ARV discount +15.0/15.0
- DSCR +10.0/10.0
- 1% rule +8.6/10.0
- Livability +3.9/5.0
- Schools +2.5/10.0
- Condition / age +2.5/5.0
- Rent growth +2.3/5.0
- Appreciation +0.0/10.0
$150,000
🖨 Deal sheet (PDF) 📄 Offer letter ✓ Due diligence
Listing remarks MLS
Investor or Builder Special! The value is in the land, the home needs significant work and is being sold as-is. Located on a nicely sized, fully fenced lot with past commercial zoning, offering great potential for redevelopment. Prime location close to shopping, restaurants, and more. Don't miss this opportunity in a high-demand area!
Key facts
- Fully fenced lot
- Prime location
- 0.37 acre lot
Tags
Neighborhood map
What this means for you Summary
Snapshot
- This is a 3-bed/1.0-bath single-family listed at $150k.
Deal economics
- At list price, monthly cash flow is $591 ($7k/yr) — positive.
- The deal already cash-flows at list — no discount required.
- Meets the 1% rule at list price ($2k rent vs $150k).
- Recommended offer: $132k (12.0% below list) — sets the bar for market timing.
- Cap rate 11.0% vs local median 3.6% in Troy — top-decile yield for the area; either an underpriced asset or a hidden risk that comps aren't pricing in. Stress-test before assuming the spread holds.
Location & tenants
- Location reads 78/100 on livability (#113 in MI, #2,684 nationally) — a middle-class / working-renter tenant base. Strengths: employment A+, housing A+, schools A; Watch: health & safety D+, amenities F, commute F.
- Warren Consolidated Schools (urban): math 18% / reading 39% proficiency, ranked #373 of 540 in MI (top 69%) — low school quality limits family demand, transient renter base, plan for 1-2y turnover.
- Market conditions: Rents soft (-0.6%/yr); 93 active listings in the ZIP; 14 comparable units currently listed for rent nearby; rentals at typical pace (median 23d on market — plan ~3-4 weeks tenant-placement turnaround); solid renter incomes; 2,614 units permitted in Oakland County in 2024 (721 in 5+ unit buildings).
Forward outlook
- Local home prices are declining (-3.0%/yr); year-one equity from $1k of loan paydown is wiped out by about $4k of value loss. Plan a longer hold.
- Oakland County population projected at +10% by 2050 — modest demand growth; plan on rents tracking national, not racing it.
- At projected returns (-3.0% appreciation + 0.0% rent growth), your $42k cash investment doubles in ~10 years — after that, you're playing with house money.
Negotiation context
- It's been on market 264 days — a 12% lower offer ($132k) is reasonable based on typical stale-listing flexibility.
- 8 sale attempts with the ask held roughly flat each time — persistent listings suggest the price (not the market) is what's stuck; bring a comps-based counter.
Risks & watch-outs
- Watch-outs: built in 1936 — expect roof / HVAC / electrical / plumbing capex.
- Climate carrying-cost: major flood risk — expect insurance premiums to compound above CPI over the hold.
Questions for the listing agent
- It's been on market 264 days. Have you received any prior offers? Is the seller open to a 12% concession, seller financing, or rate buy-down credit?
- Built in 1936 — when were the roof, HVAC, electrical panel, plumbing, and water heater last replaced?
- Why hasn't it sold? Are there any deal-killer items the seller is aware of (foundation, flood, title, zoning, code violations)?
- Is there a deadline driving the sale (1031 exchange, divorce, estate, relocation)? That informs how much negotiation room exists.
- Schools are A-rated — typically a magnet for longer-tenancy family renters. What's the average tenant stay here, and is there a school-zone premium baked into asking?
- What's the average days-on-market for RENTAL listings here right now (not sales)? A rising rental-DOM trend means longer vacancies and softer asking-rent achievability than the comps imply.
- What's the recent tenant-quality profile in this submarket — average credit score on applications, eviction rate, late-payment / NSF rate, and stable-employment percentage? A property-management company in the area should have these aggregated.
- How much new for-sale + rental construction is in the pipeline within 1–3 miles? Heavy new supply typically softens prices + rents 12–24 months out; constrained supply supports both.
Investment metrics
- 1% rule
- 1.36% ✓
- Cap rate
- 11.02%
- Cash-on-cash
- 16.88%
- DSCR
- 1.75
- GRM
- 6.1
CMA / ARV
- ARV (on-the-fly)
- $296,940
- Comps found
- 4
Show comp detail 4 sales within ~0.75 mi
| Address | Dist | Beds/Ba | Sqft | Sold | Price | $/sf | Match |
|---|---|---|---|---|---|---|---|
| 2149 Isabell Dr | 0.46mi | 3/2.0 | 1,040 (+3%) | 2mo | $320,000 | $308 | 68 |
| 2028 Isabell Drive Dr | 0.39mi | 3/1.0 | 1,060 (+5%) | 7mo | $224,500 | $212 | 68 |
| 2491 Athena Dr | 0.71mi | 3/1.5 | 1,037 (+3%) | 7mo | $305,000 | $294 | 55 |
| 2159 Garry Dr | 0.53mi | 3/1.0 | 963 (-5%) | 17mo | $235,000 | $244 | 53 |
Match score weights: distance 35% · size 25% · config 20% · recency 20%. Top-matched comps best support the ARV.
Projected returns pro-forma
-3.0% appreciation · 0.0% rent growth · sell at horizon
- IRR
- 4.7%
- Equity multiple
- 1.17×
- Total profit
- $7,344
- Equity at exit
- $22,365
- IRR
- 11.2%
- Equity multiple
- 1.76×
- Total profit
- $31,761
- Equity at exit
- $12,969
Cash invested: $42,000 (down + closing). Projections, not guarantees.
Landlord ↔ Tenant lean methodology
- Overall (STATE)
- 62 Landlord-Friendly
- State Michigan
- 62 Landlord-Friendly · EVEN
- County
- — inherits STATE
- City
- — inherits STATE
ZIP-level market 48083
- Rents YoY
- -0.6%
- Active inventory
- 93
- Price-to-rent
- 6.1×
Monthly cashflow live
- Estimated rent
- $2,047 high interval (Pro) →
- Mortgage (P&I)
- −$787
- Tax from tax record
- −$177 /mo · $2,124/yr
- Insurance
- −$62
- HOA
- −$0
- Vacancy / Maint / Mgmt
- −$430
- Net cashflow
- $591
Break-even live
Sensitivity live
| Price | -10% $676 | -5% $633 | +0% $591 | +5% $548 | +10% $506 |
|---|---|---|---|---|---|
| Rent | -10% $429 | -5% $510 | +0% $591 | +5% $672 | +10% $752 |
| Rate | -1.0pp $666 | -0.5pp $629 | base $591 | +0.5pp $552 | +1.0pp $512 |
UW: 25.0% down · 7.5% · 30yr · 1.5% tax · 5.0% vac · 8.0% maint · 8.0% mgmt
Financing live
Cash to close
- Down payment
- $37,500
- Closing costs
- $4,500
- Reserves months
- —
- Total cash needed
- —
Loan-product check · same deal, 3 products live
Conventional
25% down · 7.5% · 30yr
- Down + closing
- —
- Monthly P&I
- —
- Monthly cashflow
- —
- DSCR
- —
- Eligible?
- —
Personal DTI + credit; lowest rate.
DSCR
20% down · 8.5% · 30yr
- Down + closing
- —
- Monthly P&I
- —
- Monthly cashflow
- —
- DSCR
- —
- Eligible?
- —
No personal income docs; deal must DSCR.
Hard money
10% down · 12.0% · 12mo
- Down + closing
- —
- Monthly P&I
- —
- Monthly cashflow
- —
- DSCR
- —
- Eligible?
- —
Short-term bridge; refi at stabilization.
Rent comps 14 comps
| Address | Beds | Baths | Sqft | Rent | $/sqft | DOM | Units | Dist |
|---|---|---|---|---|---|---|---|---|
| 2081 Newburgh Dr Troy, MI | 3.0 | 2.0 | 1500 | $2,300 | $1.53 | 45d | 1 | 0.16mi |
| Canterbury Square Troy, MI | 1.0–2.0 | 1.0–2.0 | 820 | $1,595 | $1.95 | 0d | 12 | 0.65mi |
| 2226 Orpington Dr Troy, MI | 3.0 | 2.0 | 1421 | $2,495 | $1.76 | 11d | 1 | 0.98mi |
| 3043 Heritage Dr Troy, MI | 3.0 | 1.0 | 1250 | $2,100 | $1.68 | 45d | 1 | 1.11mi |
| 34400 Dequindre Rd Sterling Heights, MI | 1.0–2.0 | 1.0–2.0 | 898 | $1,540 | $1.71 | 13d | 2 | 1.13mi |
| 34800 Moravian Dr Sterling Heights, MI | 1.0–2.0 | 1.0–1.5 | 850 | $1,680 | $1.98 | 0d | 22 | 1.15mi |
| 34800 Moravian Dr Sterling Heights, MI | 1.0–2.0 | 1.0–2.0 | 810 | $1,415 | $1.75 | 23d | 16 | 1.15mi |
| 1034 Kelley St Troy, MI | 2.0 | 1.5 | 1034 | $1,795 | $1.74 | 25d | 1 | 1.15mi |
| 2497 Avalon Dr Troy, MI | 3.0 | 2.0 | 1400 | $2,500 | $1.79 | 11d | 1 | 1.18mi |
| 36200 Dequindre Rd Sterling Heights, MI | 1.0–2.0 | 1.0–2.0 | 875 | $1,860 | $2.12 | 0d | 47 | 1.20mi |
| 1147 Beaver Run Troy, MI | 2.0 | 2.0 | 1444 | $2,100 | $1.45 | 25d | 1 | 1.23mi |
| 1156 Faulkner Troy, MI | 3.0 | 2.0 | 1156 | $2,000 | $1.73 | 45d | 1 | 1.24mi |
| 2252 Winston Dr Sterling Heights, MI | 3.0 | 2.0 | 950 | $2,100 | $2.21 | 12d | 1 | 1.39mi |
| 2252 Winston Dr Sterling Heights, MI | 3.0 | 1.0 | 950 | $1,900 | $2.00 | 23d | 1 | 1.39mi |
Listing history 16 events
-
2026-04-28status Pending 336-char remark
Show marketing remark (336 chars)
Investor or Builder Special! The value is in the land, the home needs significant work and is being sold as-is. Located on a nicely sized, fully fenced lot with past commercial zoning, offering great potential for redevelopment. Prime location close to shopping, restaurants, and more. Don't miss this opportunity in a high-demand area!
-
2026-04-28status Pending
Show marketing remark (336 chars)
Investor or Builder Special! The value is in the land, the home needs significant work and is being sold as-is. Located on a nicely sized, fully fenced lot with past commercial zoning, offering great potential for redevelopment. Prime location close to shopping, restaurants, and more. Don't miss this opportunity in a high-demand area!
-
2025-08-11status Active 336-char remark
Show marketing remark (336 chars)
Investor or Builder Special! The value is in the land, the home needs significant work and is being sold as-is. Located on a nicely sized, fully fenced lot with past commercial zoning, offering great potential for redevelopment. Prime location close to shopping, restaurants, and more. Don't miss this opportunity in a high-demand area!
-
2025-08-11status Active
Show marketing remark (336 chars)
Investor or Builder Special! The value is in the land, the home needs significant work and is being sold as-is. Located on a nicely sized, fully fenced lot with past commercial zoning, offering great potential for redevelopment. Prime location close to shopping, restaurants, and more. Don't miss this opportunity in a high-demand area!
-
2025-08-04status Pending
Show marketing remark (336 chars)
Investor or Builder Special! The value is in the land, the home needs significant work and is being sold as-is. Located on a nicely sized, fully fenced lot with past commercial zoning, offering great potential for redevelopment. Prime location close to shopping, restaurants, and more. Don't miss this opportunity in a high-demand area!
-
2025-08-04status Pending 336-char remark
Show marketing remark (336 chars)
Investor or Builder Special! The value is in the land, the home needs significant work and is being sold as-is. Located on a nicely sized, fully fenced lot with past commercial zoning, offering great potential for redevelopment. Prime location close to shopping, restaurants, and more. Don't miss this opportunity in a high-demand area!
-
2025-08-01$150,000 Active 336-char remark
Show marketing remark (336 chars)
Investor or Builder Special! The value is in the land, the home needs significant work and is being sold as-is. Located on a nicely sized, fully fenced lot with past commercial zoning, offering great potential for redevelopment. Prime location close to shopping, restaurants, and more. Don't miss this opportunity in a high-demand area!
-
2025-08-01$150,000 Active
Show marketing remark (336 chars)
Investor or Builder Special! The value is in the land, the home needs significant work and is being sold as-is. Located on a nicely sized, fully fenced lot with past commercial zoning, offering great potential for redevelopment. Prime location close to shopping, restaurants, and more. Don't miss this opportunity in a high-demand area!
-
2025-06-26historical
-
2025-06-26historical
-
2025-06-25$79,900 Active
-
2025-06-25$79,900 Active
-
2025-04-07historical
-
2025-04-07historical
-
2025-04-03$80,000 Active
-
2025-04-03$80,000 Active
ⓘ Source: listings_history table (triggers on properties + properties_extension) + one-shot
backfill from property_details.listing_events for pre-trigger history.
Tax reassessment forecast MI · Partial reset (capped growth)
- Current annual tax
- $2,124 · $177/mo
- Projected year-2 tax
- $2,217 · $185/mo
- Expected delta
- +$93/yr (+$8/mo · 4.4%)
ⓘ Screening estimate from a state-policy table — verify with the county assessor before closing.
Climate risk First Street
- Flood 6/10 Major FEMA zone X (unshaded) · 98% chance over 30 yrs
- Wildfire 1/10 Low
- Heat 3/10 Moderate 7 d/yr ≥97°F today · 15 d/yr by 30 yrs out
- Wind 2/10 Low
- Air quality 3/10 Moderate 3 unhealthy d/yr today · 4 by 30 yrs out
Nearby sold comps map
Loading sold comps map…
Walkable amenities ~0.75 mi
Loading nearby amenities…
Taxation est. · year 1
- Rental income
- $24,559
- − Mortgage interest
- −$8,402
- − Property taxes
- −$2,124
- − Insurance
- −$750
- − Repairs & maintenance
- −$1,965
- − Management
- −$1,965
- − Depreciation
- −$4,364
- Taxable income
- $4,990
- Est. tax owed @ 24.0%
- −$1,198
- After-tax cash flow
- $5,891/yr
For passive investors: Depreciation is non-cash, so a rental often shows a tax loss while cash-flowing — sheltering income. Rental losses are passive: they offset passive income freely, and up to $25,000/yr can offset ordinary (W-2) income if you actively participate and your MAGI is under $100k (phasing out to $0 by $150k); unused losses carry forward. On sale, claimed depreciation is recaptured at up to 25%, and gains may owe capital-gains tax (a 1031 exchange can defer both). Figures are a year-1 estimate at your 24.0% rate — not tax advice; consult a CPA.
Schools (NCES district)
- District
- Warren Consolidated Schools
- NCES district ID
- 2635190
- Math proficiency
- 18% ▼ -14.00%
- Reading proficiency
- 39% ▼ -8.00%
- Median HH income
- $52,259
- Composite
- 25.09/100
- National rank
- #7533
- State rank
- #373 of 540 in MI
Livability — Troy
- Score
- 78/100
- State rank
- #113
- US rank
- #2684
Category grades
Schools grade is shown separately in the Schools card above.
Census & demographics
- Census place
- Troy, MI
- County
- Oakland County · 1,009,092 people
- City population
- 87,898
- Metro
- Detroit-Warren-Dearborn, MI
- Population (ZIP)
- 23,771
- Household income
- $90,794
- Rent vs Own
- Severe rent burden
- 511.0
Population outlook (Oakland County) Hauer SSP2
- Today (2025)
- 1,335,747 people
- By 2030
- 1,375,100 · +2.9%
- By 2040
- 1,435,385 · +7.5%
- By 2050
- 1,469,250 · +10.0%
- By 2075
- 1,531,946 · +14.7%
- By 2100
- 1,450,485 · +8.6%
Race, ethnicity, and origin ACS 2023
- Neighborhood character
- Majority White (64%)
- Race & ethnicity
- White 64% Asian 23% Two or more races 5% Black 4% Hispanic / Latino 3%
- Common ancestry
- Romanian 7% Lithuanian 6% Arab 3%
- Foreign-born
- 31% · China, Canada, South Korea
- Languages at home
- 67% English-only · Other Indo-European 10% Other Asian/Pacific 6% Arabic 5%
Political lean MEDSL · Oakland
- 2024 margin
- D (+10.6) · D 54.4% · R 43.8% · Other 1.9%
- 2008→2024 swing
- -3.9pp toward R · 2008: 14.5pp · 2024: 10.6pp
- All cycles
- 2024: D+10.6 2020: D+14.1 2016: D+8.1 2012: D+8.1 2008: D+14.5
Not yet ingested
- Civics
- —
Market trends
- HPI YoY
- ▼ -351.17%
- Current HPI
- 175.8232
- Rent YoY
- ▼ -0.62%
- Metro
- Detroit-Warren-Dearborn, MI
- State GDP YoY
- ▲ 1.37%
- F500 in state
- 28
Industry mix (Fortune 500 HQ in MI)
| Industry | F500 HQs | Revenue |
|---|---|---|
| Automotive Parts | 3 | $48B |
|
||
| Automotive | 2 | $372B |
|
||
| Chemicals | 1 | $45B |
|
||
| Automotive Retail | 1 | $29B |
|
||
| Healthcare / Medical Devices | 1 | $23B |
|
||
| Automotive Technology | 1 | $20B |
|
||
Price history
+87.5% since first listed16 events — show timeline
- 2026-04-28 Pending — MiRealSource-MiMLS
- 2026-04-28 Pending — REALCOMP
- 2025-08-11 Relisted — MiRealSource-MiMLS
- 2025-08-11 Relisted — REALCOMP
- 2025-08-04 Pending — REALCOMP
- 2025-08-04 Pending — MiRealSource-MiMLS
- 2025-08-01 Listed $150,000 MiRealSource-MiMLS
- 2025-08-01 Listed $150,000 REALCOMP
- 2025-06-26 Listing Removed — REALCOMP
- 2025-06-26 Listing Removed — MiRealSource-MiMLS
- 2025-06-25 Listed $79,900 REALCOMP
- 2025-06-25 Listed $79,900 MiRealSource-MiMLS
- 2025-04-07 Listing Removed — MiRealSource-MiMLS
- 2025-04-07 Listing Removed — REALCOMP
- 2025-04-03 Listed $80,000 REALCOMP
- 2025-04-03 Listed $80,000 MiRealSource-MiMLS
Property tax history
+3.2%/yrLatest (2025): $2,124 · +5.7% YoY. Source: county tax records.
Cash-flow waterfall
monthlySold comps — $/sqft
last 12 mo · ≤1 miLoading sold comps…