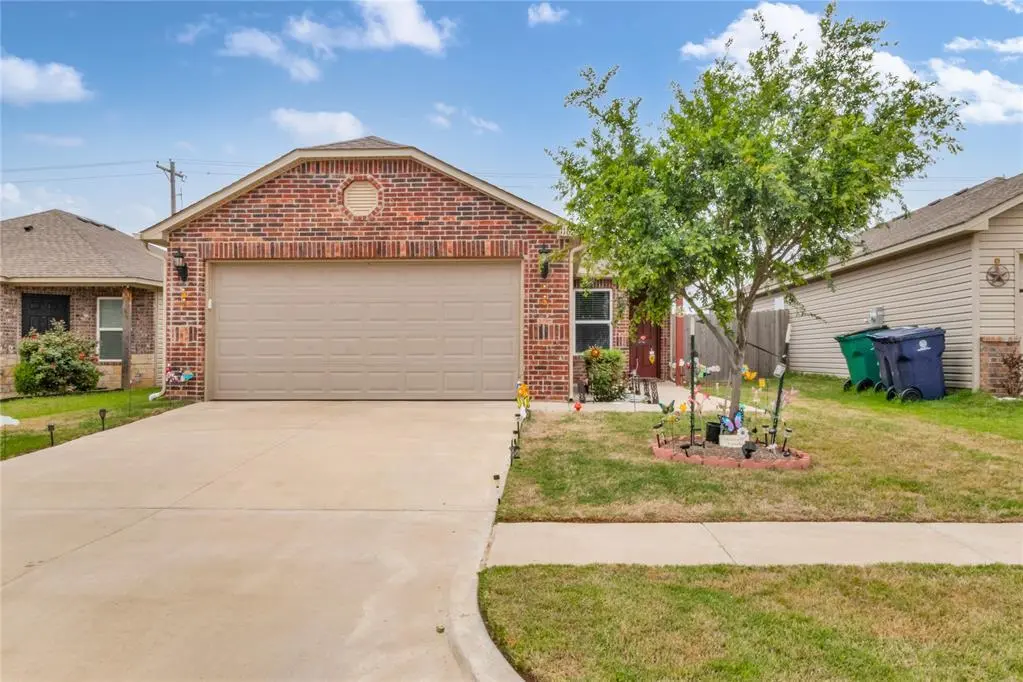
11625 Jude Way
Oklahoma City, OK 73099
$219,000F
3 bd · 2.0 ba ·
1,236 sqft ·
Built 2022
· SingleFamily
· Active
· 52 DOM
Cashflow @ list (25.0% down · 7.5%)
Estimated rent
$1,766/mo
Mortgage (P&I)
−$1,148
Tax + insurance
−$321
HOA
−$19
Vac / Maint / Mgmt
−$371
Net cashflow
$-93/mo
Annual
$-1,117/yr
Cap rate
5.78%
Cash-on-cash
-1.82%
DSCR
0.92
1% rule
0.81%
Cash to close
$61,320
Investor read
- This is a 3-bed/2.0-bath single-family listed at $219k. Condition is rated good.
- At list price, monthly cash flow is $-93 ($-1k/yr) — negative.
- To cash-flow at today's rent, offer at most $203k (7.5% below list).
- To meet the 1% rule (rent ≥ 1% of price), the offer needs to be $177k (19.3% below list).
- It's been on market 52 days — a 3% lower offer ($212k) is reasonable based on typical stale-listing flexibility.
- Recommended offer: $177k (19.3% below list) — sets the bar for 1% rule.
- Local home prices are declining (-3.0%/yr); year-one equity from $2k of loan paydown is wiped out by about $7k of value loss. Plan a longer hold.
- Location reads 80/100 on livability (#3 in OK, #1,635 nationally) — a professional / high-income tenant draw. Strengths: amenities A+, commute A+, cost of living A+; Watch: crime F.
- Piedmont (rural): math 37% / reading 39% proficiency, ranked #9 of 270 in OK (top 3%) — families likely to look elsewhere, expect single-tenant / working-renter base with shorter leases; only 15% free/reduced lunch — higher-income household profile.
- Zoned schools: Northwood Es (math 47% / reading 37%, grade F, #84 of 845 statewide, top 11%, 469 students, 0% FRL); Piedmont Hs (math 38% / reading 44%, grade F, #24 of 447 statewide, top 5%, 1,422 students, 0% FRL).
- Market conditions: Rents rising (+1.2%/yr); 1560 active listings in the ZIP; 16 comparable units currently listed for rent nearby; rentals at typical pace (median 22d on market — plan ~3-4 weeks tenant-placement turnaround); solid renter incomes; 260 units permitted in Canadian County in 2024 (0 in 5+ unit buildings).
- Canadian County population projected at +64% by 2050 — long-run rental-demand tailwind backs the buy-and-hold thesis.
- 3 sale attempts since 4y ago with the ask held roughly flat each time — persistent listings suggest the price (not the market) is what's stuck; bring a comps-based counter.
- Cap rate 5.8% vs local median 3.7% in Oklahoma City — top-decile yield for the area; either an underpriced asset or a hidden risk that comps aren't pricing in. Stress-test before assuming the spread holds.
Questions for listing agent
- What do current leases actually rent for vs. the listed asking? Can we see a recent rent roll and the last 12 months of T-12 income?
- It's been on market 52 days. Have you received any prior offers? Is the seller open to a 19% concession, seller financing, or rate buy-down credit?
- What does the HOA fee cover, when was the last increase, and are there any pending special assessments or reserve-fund shortfalls?
- Is there a deadline driving the sale (1031 exchange, divorce, estate, relocation)? That informs how much negotiation room exists.
- Schools are F-rated, which usually means shorter tenancies and higher turnover. Who's the typical renter profile here, and what's been the actual vacancy rate?
- Crime grade is F in this area — have there been break-ins, vandalism, or insurance claims at this property in the last 3 years? What carrier currently insures it and at what premium?
- The area grade is low — what's the realistic commute time and amenity access for the typical tenant pool here? Any planned neighborhood developments (good or bad) we should know about?
- What's the average days-on-market for RENTAL listings here right now (not sales)? A rising rental-DOM trend means longer vacancies and softer asking-rent achievability than the comps imply.
CashFlowRE · CFR-NXPJ7S47HT2Y7A
· Data 2 days ago
cashflowre.app · 2026-05-29