11625 Jude Way · Oklahoma City, OK
Flood risk No data
- FEMA flood zone
- —
- Chance of flooding over 30 yrs
- —
- Est. flood insurance / yr
- —
Fire risk No data
- Est. fire insurance / yr
- —
Heat risk No data
- Hot days now (above threshold)
- —
- Hot days in 30 yrs
- —
Wind risk No data
- Chance of severe wind over 30 yrs
- —
Air-quality risk No data
- Unhealthy air days now
- —
- Unhealthy air days in 30 yrs
- —
Risk factors via First Street. Map © Google.
Why this score? — see what drove the F grade
The composite is a weighted blend of 9 inputs, each scored 0–100. Each bar is that input's sub-score; the figure is the points it added to the 100-point composite (weight × sub-score).
- Cash flow +11.0/30.0
- Livability +4.0/5.0
- Condition / age +3.8/5.0
- ARV discount +3.6/15.0
- Schools +3.6/10.0
- DSCR +3.2/10.0
- 1% rule +3.1/10.0
- Rent growth +2.8/5.0
- Appreciation +0.0/10.0
$219,000
🖨 Deal sheet 📄 Offer letter ✓ Due diligence
Listing remarks MLS
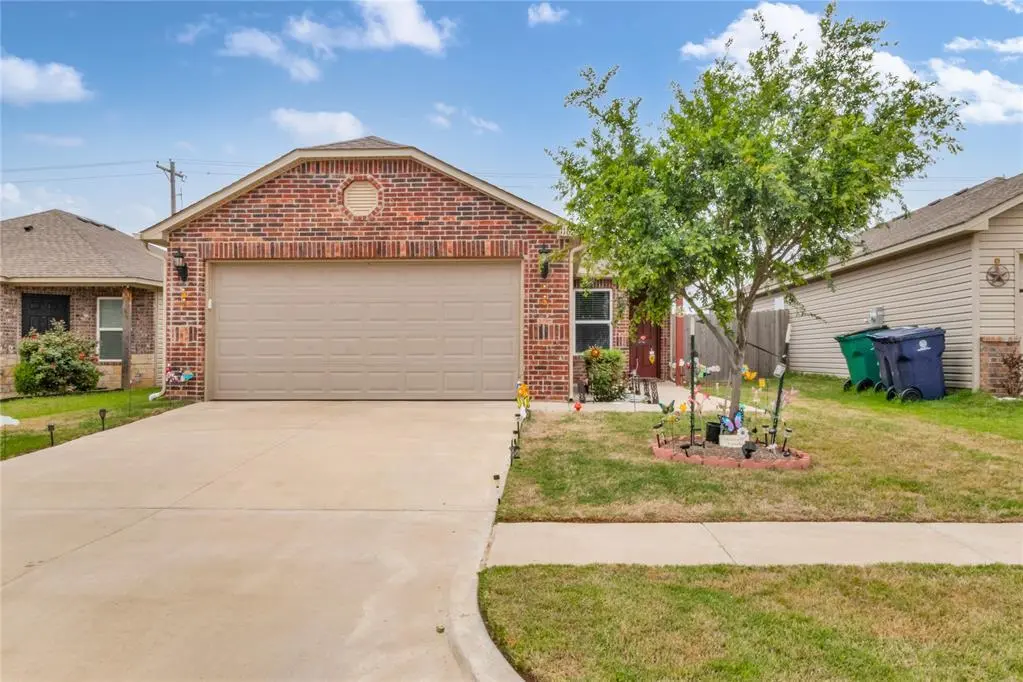
The COOPER floor plan is rich with curb appeal with its welcoming covered front entry and front yard landscaping. This home features an open floor plan with 3 bedrooms, 2 bathrooms, a spacious family room, and a beautiful dining area/kitchen fully equipped with energy-efficient appliances, ample counter space, and a roomy pantry for the adventurous home chef. Home is currently under construction with anticipated completion in September.
Key facts
- 4,805 sq ft lot
- 2 garage spots
- Built 2022
Property features AI
Finance
- Other: Living area listed as 1,236 (assessor); Homestead not indicated; Located in Robertsons Landing Ph 3
- Financial info: Loan qualification: Yes
- HOA & community: Mandatory association dues ($225) covering common area maintenance
Exterior
- Parking: 2-car garage
- Home design: Single-family residence; One level; Residential property
- Construction: Brick and vinyl siding exterior; Composition roof; Combination foundation; Existing construction
- Exterior features: Open patio; Interior lot
Interior
- Bedrooms: 3 bedrooms
- Bathrooms: 2 full bathrooms
- Interior features: One living area; No fireplace
Neighborhood map
What this means for you Summary
Snapshot
- This is a 3-bed/2.0-bath single-family listed at $219k. Condition is rated good.
Deal economics
- At list price, monthly cash flow is $-93 ($-1k/yr) — negative.
- To cash-flow at today's rent, offer at most $203k (7.5% below list).
- To meet the 1% rule (rent ≥ 1% of price), the offer needs to be $177k (19.3% below list).
- Recommended offer: $177k (19.3% below list) — sets the bar for 1% rule.
- Cap rate 5.8% vs local median 3.7% in Oklahoma City — top-decile yield for the area; either an underpriced asset or a hidden risk that comps aren't pricing in. Stress-test before assuming the spread holds.
Location & tenants
- Location reads 80/100 on livability (#3 in OK, #1,635 nationally) — a professional / high-income tenant draw. Strengths: amenities A+, commute A+, cost of living A+; Watch: crime F.
- Piedmont (rural): math 37% / reading 39% proficiency, ranked #9 of 270 in OK (top 3%) — families likely to look elsewhere, expect single-tenant / working-renter base with shorter leases; only 15% free/reduced lunch — higher-income household profile.
- Zoned schools: Northwood Es (math 47% / reading 37%, grade F, #84 of 845 statewide, top 11%, 469 students, 0% FRL); Piedmont Hs (math 38% / reading 44%, grade F, #24 of 447 statewide, top 5%, 1,422 students, 0% FRL).
- Market conditions: Rents rising (+1.2%/yr); 1560 active listings in the ZIP; 16 comparable units currently listed for rent nearby; rentals at typical pace (median 22d on market — plan ~3-4 weeks tenant-placement turnaround); solid renter incomes; 260 units permitted in Canadian County in 2024 (0 in 5+ unit buildings).
Forward outlook
- Local home prices are declining (-3.0%/yr); year-one equity from $2k of loan paydown is wiped out by about $7k of value loss. Plan a longer hold.
- Canadian County population projected at +64% by 2050 — long-run rental-demand tailwind backs the buy-and-hold thesis.
Negotiation context
- It's been on market 52 days — a 3% lower offer ($212k) is reasonable based on typical stale-listing flexibility.
- 3 sale attempts since 4y ago with the ask held roughly flat each time — persistent listings suggest the price (not the market) is what's stuck; bring a comps-based counter.
Questions for the listing agent
- What do current leases actually rent for vs. the listed asking? Can we see a recent rent roll and the last 12 months of T-12 income?
- It's been on market 52 days. Have you received any prior offers? Is the seller open to a 19% concession, seller financing, or rate buy-down credit?
- What does the HOA fee cover, when was the last increase, and are there any pending special assessments or reserve-fund shortfalls?
- Is there a deadline driving the sale (1031 exchange, divorce, estate, relocation)? That informs how much negotiation room exists.
- Schools are F-rated, which usually means shorter tenancies and higher turnover. Who's the typical renter profile here, and what's been the actual vacancy rate?
- Crime grade is F in this area — have there been break-ins, vandalism, or insurance claims at this property in the last 3 years? What carrier currently insures it and at what premium?
- The area grade is low — what's the realistic commute time and amenity access for the typical tenant pool here? Any planned neighborhood developments (good or bad) we should know about?
- What's the average days-on-market for RENTAL listings here right now (not sales)? A rising rental-DOM trend means longer vacancies and softer asking-rent achievability than the comps imply.
- What's the recent tenant-quality profile in this submarket — average credit score on applications, eviction rate, late-payment / NSF rate, and stable-employment percentage? A property-management company in the area should have these aggregated.
- How much new for-sale + rental construction is in the pipeline within 1–3 miles? Heavy new supply typically softens prices + rents 12–24 months out; constrained supply supports both.
Investment metrics
- 1% rule
- 0.81% ✗
- Cap rate
- 5.78%
- Cash-on-cash
- -1.82%
- DSCR
- 0.92
- GRM
- 10.3
CMA / ARV
- ARV (on-the-fly)
- $201,468
- Comps found
- 12
Show comp detail 12 sales within ~0.75 mi
| Address | Dist | Beds/Ba | Sqft | Sold | Price | $/sf | Match |
|---|---|---|---|---|---|---|---|
| 11821 Casey Dr | 0.18mi | 3/2.0 | 1,209 (-2%) | 4mo | $210,000 | $174 | 85 |
| 9617 NW 123rd St | 0.49mi | 3/2.0 | 1,302 (+5%) | 2mo | $219,900 | $169 | 66 |
| 12921 Florence Ln | 0.73mi | 3/2.0 | 1,248 (+1%) | 1mo | $203,500 | $163 | 63 |
| 12932 Florence Ln | 0.74mi | 3/2.0 | 1,248 (+1%) | 3mo | $218,900 | $175 | 62 |
| 12937 Florence Ln | 0.74mi | 3/2.0 | 1,248 (+1%) | 4mo | $217,900 | $175 | 61 |
| 9444 NW 122nd Ter | 0.42mi | 3/2.0 | 1,388 (+12%) | 2mo | $225,000 | $162 | 59 |
| 12912 Florence Ln | 0.73mi | 3/2.0 | 1,373 (+11%) | 1mo | $221,388 | $161 | 47 |
| 12933 Florence Ln | 0.74mi | 3/2.0 | 1,373 (+11%) | 1mo | $226,350 | $165 | 46 |
| 12924 Florence Ln | 0.73mi | 3/2.0 | 1,373 (+11%) | 2mo | $219,300 | $160 | 46 |
| 12916 Florence Ln | 0.73mi | 3/2.0 | 1,402 (+13%) | 1mo | $226,000 | $161 | 42 |
| 12929 Florence Ln | 0.73mi | 3/2.0 | 1,402 (+13%) | 2mo | $224,100 | $160 | 42 |
| 12928 Florence Ln | 0.74mi | 3/2.0 | 1,402 (+13%) | 3mo | $224,897 | $160 | 41 |
Match score weights: distance 35% · size 25% · config 20% · recency 20%. Top-matched comps best support the ARV.
Projected returns pro-forma
-3.0% appreciation · 1.19% rent growth · sell at horizon
- IRR
- -21.3%
- Equity multiple
- 0.27×
- Total profit
- $-44,562
- Equity at exit
- $32,654
- IRR
- -19.6%
- Equity multiple
- 0.04×
- Total profit
- $-58,892
- Equity at exit
- $18,935
Cash invested: $61,320 (down + closing). Projections, not guarantees.
Landlord ↔ Tenant lean methodology
- Overall (STATE)
- 83 Strongly Landlord-Friendly
- State Oklahoma
- 83 Strongly Landlord-Friendly · R+20
- County
- — inherits STATE
- City
- — inherits STATE
ZIP-level market 73099
- Rents YoY
- 1.2%
- Active inventory
- 1560
- Price-to-rent
- 10.3×
Monthly cashflow live
- Estimated rent
- $1,766 high interval (Pro) →
- Mortgage (P&I)
- −$1,148
- Tax from tax record
- −$230 /mo · $2,757/yr
- Insurance
- −$91
- HOA
- −$19
- Vacancy / Maint / Mgmt
- −$371
- Net cashflow
- $-93
Break-even live
UW: 25.0% down · 7.5% · 30yr · 1.5% tax · 5.0% vac · 8.0% maint · 8.0% mgmt
Financing live
Cash to close
- Down payment
- $54,750
- Closing costs
- $6,570
- Reserves months
- —
- Total cash needed
- —
Loan-product check · same deal, 3 products live
Conventional
25% down · 7.5% · 30yr
- Down + closing
- —
- Monthly P&I
- —
- Monthly cashflow
- —
- DSCR
- —
- Eligible?
- —
Personal DTI + credit; lowest rate.
DSCR
20% down · 8.5% · 30yr
- Down + closing
- —
- Monthly P&I
- —
- Monthly cashflow
- —
- DSCR
- —
- Eligible?
- —
No personal income docs; deal must DSCR.
Hard money
10% down · 12.0% · 12mo
- Down + closing
- —
- Monthly P&I
- —
- Monthly cashflow
- —
- DSCR
- —
- Eligible?
- —
Short-term bridge; refi at stabilization.
Rent comps 16 comps
| Address | Beds | Baths | Sqft | Rent | $/sqft | DOM | Units | Dist |
|---|---|---|---|---|---|---|---|---|
| 11709 Jude Way Yukon, OK | 4.0 | 2.0 | 1459 | $1,661 | $1.14 | 23d | 1 | 0.03mi |
| 11628 Annette Dr Yukon, OK | 3.0 | 2.0 | 1248 | $1,555 | $1.25 | 23d | 1 | 0.21mi |
| 11625 Krew Way Yukon, OK | 4.0 | 2.0 | 1459 | $1,595 | $1.09 | 4d | 1 | 0.23mi |
| 11620 Krew Way Yukon, OK | 4.0 | 2.0 | 1459 | $1,725 | $1.18 | 2d | 1 | 0.27mi |
| 11505 Mackenzie Way Yukon, OK | 3.0 | 2.0 | 1200 | $1,495 | $1.25 | 20d | 1 | 0.73mi |
| 11606 Mackenzie Way Yukon, OK | 3.0 | 2.0 | 1215 | $2,850 | $2.35 | 23d | 1 | 0.76mi |
| 11608 Mackenzie Way Yukon, OK | 3.0 | 2.5 | 1259 | $1,495 | $1.19 | 10d | 1 | 0.76mi |
| 11608 Mackenzie Way Yukon, OK | 3.0 | 2.5 | 1259 | $1,545 | $1.23 | 14d | 1 | 0.76mi |
| 12845 Torretta Way Yukon, OK | 4.0 | 2.0 | 1459 | $1,745 | $1.20 | 11d | 1 | 0.77mi |
| 12845 Torretta Way Yukon, OK | 4.0 | 2.0 | 1459 | $1,745 | $1.20 | 17d | 1 | 0.77mi |
| 12008 Brinley Reign Dr Yukon, OK | 3.0 | 2.0 | 1382 | $1,850 | $1.34 | 23d | 1 | 0.79mi |
| 12816 Torretta Way Yukon, OK | 4.0 | 2.0 | 1459 | $1,730 | $1.19 | 4d | 1 | 0.80mi |
| 9109 NW 127th St Oklahoma City, OK | 3.0 | 2.0 | 1400 | $1,845 | $1.32 | 23d | 1 | 0.96mi |
| 9109 NW 127th St Oklahoma City, OK | 3.0 | 2.0 | 1400 | $1,845 | $1.32 | 21d | 1 | 0.96mi |
| 8922 NW 109th Ter Oklahoma City, OK | 3.0 | 2.5 | 1412 | $1,600 | $1.13 | 23d | 1 | 0.97mi |
| 9017 NW 127th St Oklahoma City, OK | 3.0 | 2.0 | 1200 | $1,695 | $1.41 | 23d | 1 | 1.00mi |
HOA detail
- Monthly dues
- $19 · $228/yr
- Likely covers
- landscaping
Listing history 21 events
-
2026-06-18days on market $219,000 Active 52 DOM
-
2026-06-17days on market $219,000 Active 51 DOM
-
2026-06-16days on market $219,000 Active 50 DOM
-
2026-06-15days on market $219,000 Active 49 DOM
-
2026-06-13days on market $219,000 Active 47 DOM
-
2026-06-13days on market $219,000 Active 46 DOM
-
2026-06-09days on market $219,000 Active 43 DOM
-
2026-06-08days on market $219,000 Active 42 DOM
-
2026-06-07days on market $219,000 Active 41 DOM
-
2026-06-03days on market $219,000 Active 37 DOM
-
2026-06-02days on market $219,000 Active 36 DOM
-
2026-06-01days on market $219,000 Active 35 DOM
-
2026-05-31days on market $219,000 Active 34 DOM
-
2026-04-27$219,000 Active
-
2026-03-06historical
-
2026-01-16price $225,000
-
2025-09-04$245,000 Active
-
2022-11-23soldstatus $215,850 Closed 440-char remark
Show marketing remark (440 chars)
The COOPER floor plan is rich with curb appeal with its welcoming covered front entry and front yard landscaping. This home features an open floor plan with 3 bedrooms, 2 bathrooms, a spacious family room, and a beautiful dining area/kitchen fully equipped with energy-efficient appliances, ample counter space, and a roomy pantry for the adventurous home chef. Home is currently under construction with anticipated completion in September.
-
2022-09-20status Pending 440-char remark
Show marketing remark (440 chars)
The COOPER floor plan is rich with curb appeal with its welcoming covered front entry and front yard landscaping. This home features an open floor plan with 3 bedrooms, 2 bathrooms, a spacious family room, and a beautiful dining area/kitchen fully equipped with energy-efficient appliances, ample counter space, and a roomy pantry for the adventurous home chef. Home is currently under construction with anticipated completion in September.
-
2022-08-03status Pending 440-char remark
Show marketing remark (440 chars)
The COOPER floor plan is rich with curb appeal with its welcoming covered front entry and front yard landscaping. This home features an open floor plan with 3 bedrooms, 2 bathrooms, a spacious family room, and a beautiful dining area/kitchen fully equipped with energy-efficient appliances, ample counter space, and a roomy pantry for the adventurous home chef. Home is currently under construction with anticipated completion in September.
-
2022-07-14$212,770 Active 440-char remark
Show marketing remark (440 chars)
The COOPER floor plan is rich with curb appeal with its welcoming covered front entry and front yard landscaping. This home features an open floor plan with 3 bedrooms, 2 bathrooms, a spacious family room, and a beautiful dining area/kitchen fully equipped with energy-efficient appliances, ample counter space, and a roomy pantry for the adventurous home chef. Home is currently under construction with anticipated completion in September.
ⓘ Source: listings_history table (triggers on properties + properties_extension) + one-shot
backfill from property_details.listing_events for pre-trigger history.
Tax reassessment forecast OK · Resets to sale price
- Current annual tax
- $2,757 · $230/mo
- Projected year-2 tax
- $2,757 · $230/mo
- Expected delta
- $0/yr ($0/mo · 0.0%)
ⓘ Screening estimate from a state-policy table — verify with the county assessor before closing.
Nearby sold comps map
Loading sold comps map…
Walkable amenities ~0.75 mi
Loading nearby amenities…
Taxation est. · year 1
- Rental income
- $21,196
- − Mortgage interest
- −$12,267
- − Property taxes
- −$2,757
- − Insurance
- −$1,095
- − Repairs & maintenance
- −$1,696
- − Management
- −$1,696
- − HOA
- −$228
- − Depreciation
- −$6,371
- Taxable loss
- −$4,914
- Est. tax savings @ 24.0%
- +$1,179
- After-tax cash flow
- $63/yr
For passive investors: Depreciation is non-cash, so a rental often shows a tax loss while cash-flowing — sheltering income. Rental losses are passive: they offset passive income freely, and up to $25,000/yr can offset ordinary (W-2) income if you actively participate and your MAGI is under $100k (phasing out to $0 by $150k); unused losses carry forward. On sale, claimed depreciation is recaptured at up to 25%, and gains may owe capital-gains tax (a 1031 exchange can defer both). Figures are a year-1 estimate at your 24.0% rate — not tax advice; consult a CPA.
Condition & rehab AI · 12 photos
This well-maintained single-family home offers a good balance of curb appeal and functionality, with a good condition score and minimal repairs needed.
Value-add opportunities
- Resale Paint exterior trim — Enhances curb appeal
- Rental Clean gutters — Keeps property in good condition
Renovation cost estimate screening
Value-add ROI direction
- Resale Paint exterior trim — Enhances curb appeal ↑
- Rental Clean gutters — Keeps property in good condition ↑
ⓘ Cost ranges are severity-bucket heuristics (US national rule-of-thumb). Get contractor quotes + a written scope before underwriting a rehab budget.
Schools (NCES district)
- District
- Piedmont
- NCES district ID
- 4023970
- Math proficiency
- 37% ▼ -15.00%
- Reading proficiency
- 39% ▼ -9.00%
- Median HH income
- $83,943
- Composite
- 36.08/100
- National rank
- #4762
- State rank
- #9 of 270 in OK
Livability — Oklahoma City
- Score
- 80/100
- State rank
- #3
- US rank
- #1635
Category grades
Schools grade is shown separately in the Schools card above.
Census & demographics
- Census place
- Oklahoma City, OK
- County
- Canadian County · 154,341 people
- City population
- 498,656
- Metro
- Oklahoma City, OK
- Population (ZIP)
- 91,014
- Household income
- $88,030
- Rent vs Own
- Severe rent burden
- 1838.0
Population outlook (Canadian County) Hauer SSP2
- Today (2025)
- 174,062 people
- By 2030
- 195,170 · +12.1%
- By 2040
- 239,293 · +37.5%
- By 2050
- 285,457 · +64.0%
- By 2075
- 403,766 · +132.0%
- By 2100
- 498,766 · +186.5%
Race, ethnicity, and origin ACS 2023
- Neighborhood character
- Predominantly White (73%)
- Race & ethnicity
- White 73% Two or more races 11% Hispanic / Latino 10% Black 3% Asian 3% Native American 3%
- Hispanic origin (detail)
- Mexican 7%
- Common ancestry
- Italian 2% Slovak 1% Portuguese 1%
- Foreign-born
- 5% · Canada, Vietnam
- Languages at home
- 91% English-only · Spanish 5% Vietnamese 2% Other Asian/Pacific 1%
Political lean MEDSL · Canadian
- 2024 margin
- Solid R (+40.4) · D 28.8% · R 69.2% · Other 2.0%
- 2008→2024 swing
- +11.9pp toward D · 2008: -52.2pp · 2024: -40.4pp
- All cycles
- 2024: R+40.4 2020: R+43.3 2016: R+51.2 2012: R+54.4 2008: R+52.2
Not yet ingested
- Civics
- —
Market trends
- HPI YoY
- ▼ -206.04%
- Current HPI
- 244.6836
- Rent YoY
- ▲ 1.19%
- Metro
- Oklahoma City, OK
- State GDP YoY
- ▲ 1.55%
- F500 in state
- 6
Industry mix (Fortune 500 HQ in OK)
| Industry | F500 HQs | Revenue |
|---|---|---|
| Energy | 3 | $48B |
|
||
Price history
+2.9% since first listed8 events — show timeline
- 2026-04-27 Listed $219,000 MLSOK
- 2026-03-06 Listing Removed — MLSOK
- 2026-01-16 Price Changed $225,000 MLSOK
- 2025-09-04 Listed $245,000 MLSOK
- 2022-11-23 Sold (MLS) $215,850 MLSOK
- 2022-09-20 Pending — MLSOK
- 2022-08-03 Pending — MLSOK
- 2022-07-14 Listed $212,770 MLSOK
Property tax history
+280.6%/yrLatest (2025): $2,757 · -0.4% YoY. Source: county tax records.
Cash-flow waterfall
monthlySold comps — $/sqft
last 12 mo · ≤1 miLoading sold comps…