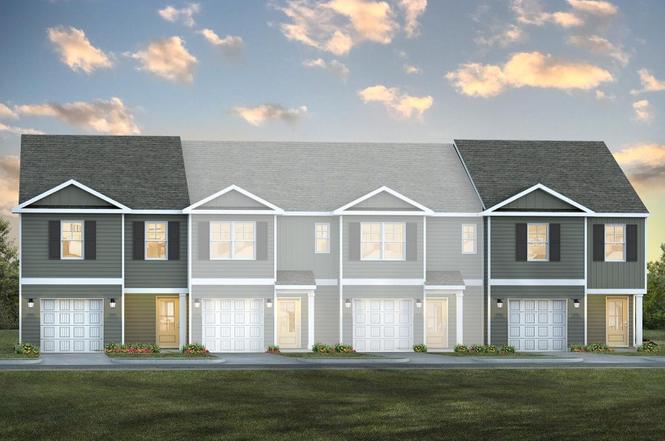
MITCHELL TH Plan
Murraysville, NC 28429
$309,990D+
4 bd · 2.5 ba ·
1,554 sqft ·
Built —
· Townhouse
· Active
· 224 DOM
Cashflow @ list (25.0% down · 7.5%)
Estimated rent
$3,078/mo
Mortgage (P&I)
−$1,728
Tax + insurance
−$549
HOA
−$0
Vac / Maint / Mgmt
−$646
Net cashflow
$155/mo
Annual
$1,855/yr
Cap rate
6.86%
Cash-on-cash
2.01%
DSCR
1.09
1% rule
0.93%
Cash to close
$92,245
Investor read
- This is a 4-bed/2.5-bath townhouse listed at $310k.
- At list price, monthly cash flow is $155 ($2k/yr) — positive.
- The deal already cash-flows at list — no discount required.
- To meet the 1% rule (rent ≥ 1% of price), the offer needs to be $308k (0.7% below list).
- It's been on market 224 days — a 12% lower offer ($273k) is reasonable based on typical stale-listing flexibility.
- Recommended offer: $273k (12.0% below list) — sets the bar for market timing.
- Local home prices are declining (-3.0%/yr); year-one equity from $2k of loan paydown is wiped out by about $10k of value loss. Plan a longer hold.
- Location reads 66/100 on livability (#294 in NC) — a middle-class / working-renter tenant base. Strengths: housing A+, cost of living A; Watch: employment C-, schools D, health & safety D.
- New Hanover County Schools (urban): math 48% / reading 53% proficiency, ranked #61 of 178 in NC (top 34%) — acceptable for families but not a draw, mixed tenant base, ~2y average lease.
- Market conditions: 185 active listings in the ZIP; 2 comparable units currently listed for rent nearby; 2,581 units permitted in New Hanover County in 2024 (1,185 in 5+ unit buildings).
- New Hanover County population projected at +37% by 2050 — long-run rental-demand tailwind backs the buy-and-hold thesis.
- Climate carrying-cost: major flood risk; severe wind risk, 99% chance of damaging wind over 30y; moderate wildfire risk; extreme-heat days projected 7→19/yr by 2055 (HVAC capex compounding) — expect insurance premiums to compound above CPI over the hold.
- Cap rate 6.9% vs local median 4.1% in Murraysville — top-decile yield for the area; either an underpriced asset or a hidden risk that comps aren't pricing in. Stress-test before assuming the spread holds.
- At $3,078/mo this rent would consume 51% of the median local household income ($72k/yr) (locally 110% of renters already pay >50% of income on rent) — very limited rent-growth headroom before tenants either downsize or default.
Questions for listing agent
- It's been on market 224 days. Have you received any prior offers? Is the seller open to a 12% concession, seller financing, or rate buy-down credit?
- Why hasn't it sold? Are there any deal-killer items the seller is aware of (foundation, flood, title, zoning, code violations)?
- Is there a deadline driving the sale (1031 exchange, divorce, estate, relocation)? That informs how much negotiation room exists.
- Schools are D-rated, which usually means shorter tenancies and higher turnover. Who's the typical renter profile here, and what's been the actual vacancy rate?
- The area grade is low — what's the realistic commute time and amenity access for the typical tenant pool here? Any planned neighborhood developments (good or bad) we should know about?
- What's the average days-on-market for RENTAL listings here right now (not sales)? A rising rental-DOM trend means longer vacancies and softer asking-rent achievability than the comps imply.
- What's the recent tenant-quality profile in this submarket — average credit score on applications, eviction rate, late-payment / NSF rate, and stable-employment percentage? A property-management company in the area should have these aggregated.
- How much new for-sale + rental construction is in the pipeline within 1–3 miles? Heavy new supply typically softens prices + rents 12–24 months out; constrained supply supports both.
CashFlowRE · CFR-NXW2WJBHP56XM4
· Data 2 days ago
cashflowre.app · 2026-05-29