 🏗️ New Construction
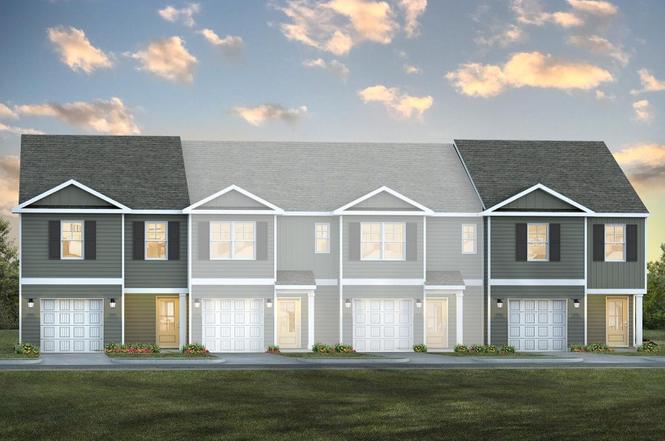
MITCHELL TH Plan · Murraysville, NC
Flood risk 6/10 · Moderate
- FEMA flood zone
- X (unshaded)
- Chance of flooding over 30 yrs
- 0.68%
- Est. flood insurance / yr
- $507 – $1,088
Fire risk 5/10 · Moderate
- Est. fire insurance / yr
- $906 – $1,684
Heat risk 9/10 · Severe
- Hot days now (above 105°F)
- 7 days/yr
- Hot days in 30 yrs
- 19 days/yr
Wind risk 8/10 · Major
- Chance of severe wind over 30 yrs
- 99.0%
Air-quality risk 1/10 · Minimal
- Unhealthy air days now
- 0 days/yr
- Unhealthy air days in 30 yrs
- 0 days/yr
Risk factors via First Street. Map © Google.
Why this score? — see what drove the D+ grade
The composite is a weighted blend of 9 inputs, each scored 0–100. Each bar is that input's sub-score; the figure is the points it added to the 100-point composite (weight × sub-score).
- Cash flow +15.9/30.0
- ARV discount +7.5/15.0
- DSCR +4.9/10.0
- 1% rule +4.3/10.0
- Schools +4.3/10.0
- Livability +3.3/5.0
- Rent growth +2.5/5.0
- Condition / age +2.5/5.0
- Appreciation +0.0/10.0
$309,990
🖨 Deal sheet 📄 Offer letter ✓ Due diligence
Listing remarks
The Mitchell is a two-story townhome with 4 bedrooms, 2.5 Baths, 1,554 square feet and 1 car garage in a prime location! Your new home is in the Landing at Castle Hayne, North Carolina in our Sidbury Station community. The kitchen features shaker-style cabinets, granite countertops, and stainless steel appliances, which are sure to both turn heads and make meal prep easy. You'll never be too far from the action with the living and dining area right there. Your new Mitchell features an open concept first floor anchored by a spacious kitchen with a peninsula bar that overlooks your family and dining room. Upstairs you will find four bedrooms and 2 full baths. In every bedroom you'll have carp
Key facts
- Spacious kitchen
- Granite countertops
- Peninsula bar
Tags
Property features AI
Finance
- Financial info: List price $319,990
Exterior
- Parking: 1 covered garage space (1 total parking space)
- Home design: Townhome/attached plan (MITCHELL TH)
- Exterior features: Living area approximately 1554 (plan)
Interior
- Bedrooms: 4 bedrooms
- Bathrooms: 2 full bathrooms, 1 half bathroom (2.5 total)
- Interior features: Plan-based new construction (MITCHELL TH)
Neighborhood map
What this means for you Summary
Snapshot
- This is a 4-bed/2.5-bath townhouse listed at $310k.
Deal economics
- At list price, monthly cash flow is $155 ($2k/yr) — positive.
- The deal already cash-flows at list — no discount required.
- To meet the 1% rule (rent ≥ 1% of price), the offer needs to be $308k (0.7% below list).
- Recommended offer: $273k (12.0% below list) — sets the bar for market timing.
- Cap rate 6.9% vs local median 4.1% in Murraysville — top-decile yield for the area; either an underpriced asset or a hidden risk that comps aren't pricing in. Stress-test before assuming the spread holds.
Location & tenants
- Location reads 66/100 on livability (#294 in NC) — a middle-class / working-renter tenant base. Strengths: housing A+, cost of living A; Watch: employment C-, schools D, health & safety D.
- New Hanover County Schools (urban): math 48% / reading 53% proficiency, ranked #61 of 178 in NC (top 34%) — acceptable for families but not a draw, mixed tenant base, ~2y average lease.
- Market conditions: 185 active listings in the ZIP; 2 comparable units currently listed for rent nearby; 2,581 units permitted in New Hanover County in 2024 (1,185 in 5+ unit buildings).
- At $3,078/mo this rent would consume 51% of the median local household income ($72k/yr) (locally 110% of renters already pay >50% of income on rent) — very limited rent-growth headroom before tenants either downsize or default.
Forward outlook
- Local home prices are declining (-3.0%/yr); year-one equity from $2k of loan paydown is wiped out by about $10k of value loss. Plan a longer hold.
- New Hanover County population projected at +37% by 2050 — long-run rental-demand tailwind backs the buy-and-hold thesis.
Negotiation context
- It's been on market 224 days — a 12% lower offer ($273k) is reasonable based on typical stale-listing flexibility.
Risks & watch-outs
- Climate carrying-cost: major flood risk; severe wind risk, 99% chance of damaging wind over 30y; moderate wildfire risk; extreme-heat days projected 7→19/yr by 2055 (HVAC capex compounding) — expect insurance premiums to compound above CPI over the hold.
Questions for the listing agent
- It's been on market 224 days. Have you received any prior offers? Is the seller open to a 12% concession, seller financing, or rate buy-down credit?
- Why hasn't it sold? Are there any deal-killer items the seller is aware of (foundation, flood, title, zoning, code violations)?
- Is there a deadline driving the sale (1031 exchange, divorce, estate, relocation)? That informs how much negotiation room exists.
- Schools are D-rated, which usually means shorter tenancies and higher turnover. Who's the typical renter profile here, and what's been the actual vacancy rate?
- The area grade is low — what's the realistic commute time and amenity access for the typical tenant pool here? Any planned neighborhood developments (good or bad) we should know about?
- What's the average days-on-market for RENTAL listings here right now (not sales)? A rising rental-DOM trend means longer vacancies and softer asking-rent achievability than the comps imply.
- What's the recent tenant-quality profile in this submarket — average credit score on applications, eviction rate, late-payment / NSF rate, and stable-employment percentage? A property-management company in the area should have these aggregated.
- How much new for-sale + rental construction is in the pipeline within 1–3 miles? Heavy new supply typically softens prices + rents 12–24 months out; constrained supply supports both.
Investment metrics
- 1% rule
- 0.93% ✗
- Cap rate
- 6.86%
- Cash-on-cash
- 2.01%
- DSCR
- 1.09
- GRM
- 8.9
CMA / ARV
- ARV (on-the-fly)
- $329,448
- Comps found
- 3
Show comp detail 3 sales within ~0.75 mi
| Address | Dist | Beds/Ba | Sqft | Sold | Price | $/sf | Match |
|---|---|---|---|---|---|---|---|
| 4321 Majesty Dr Unit 404 | 0.29mi | 4/2.5 | 1,554 (0%) | 1mo | $314,999 | $203 | 86 |
| 4328 Majesty Dr Unit 354 | 0.28mi | 3/2.5 (-1) | 1,418 (-9%) | 2mo | $299,999 | $212 | 66 |
| 4319 Majesty Dr Lot 405 | 0.29mi | 3/2.5 (-1) | 1,418 (-9%) | 1mo | $299,999 | $212 | 66 |
Match score weights: distance 35% · size 25% · config 20% · recency 20%. Top-matched comps best support the ARV.
Projected returns pro-forma
-3.0% appreciation · 3.0% rent growth · sell at horizon
- IRR
- -13.1%
- Equity multiple
- 0.53×
- Total profit
- $-43,493
- Equity at exit
- $49,122
- IRR
- -4.1%
- Equity multiple
- 0.73×
- Total profit
- $-25,007
- Equity at exit
- $28,485
Cash invested: $92,245 (down + closing). Projections, not guarantees.
Landlord ↔ Tenant lean methodology
- Overall (STATE)
- 85 Strongly Landlord-Friendly
- State North Carolina
- 85 Strongly Landlord-Friendly · R+3
- County
- — inherits STATE
- City
- — inherits STATE
ZIP-level market 28429
- Active inventory
- 185
- Price-to-rent
- 8.4×
Monthly cashflow live
- Estimated rent
- $3,078 medium interval (Pro) →
- Mortgage (P&I)
- −$1,728
- Tax est. 1.5%
- −$412 /mo · $4,942/yr
- Insurance
- −$137
- HOA
- −$0
- Vacancy / Maint / Mgmt
- −$646
- Net cashflow
- $155
Break-even live
UW: 25.0% down · 7.5% · 30yr · 1.5% tax · 5.0% vac · 8.0% maint · 8.0% mgmt
Financing live
Cash to close
- Down payment
- $82,362
- Closing costs
- $9,883
- Reserves months
- —
- Total cash needed
- —
Loan-product check · same deal, 3 products live
Conventional
25% down · 7.5% · 30yr
- Down + closing
- —
- Monthly P&I
- —
- Monthly cashflow
- —
- DSCR
- —
- Eligible?
- —
Personal DTI + credit; lowest rate.
DSCR
20% down · 8.5% · 30yr
- Down + closing
- —
- Monthly P&I
- —
- Monthly cashflow
- —
- DSCR
- —
- Eligible?
- —
No personal income docs; deal must DSCR.
Hard money
10% down · 12.0% · 12mo
- Down + closing
- —
- Monthly P&I
- —
- Monthly cashflow
- —
- DSCR
- —
- Eligible?
- —
Short-term bridge; refi at stabilization.
Rent comps 2 comps
| Address | Beds | Baths | Sqft | Rent | $/sqft | DOM | Units | Dist |
|---|---|---|---|---|---|---|---|---|
| 6105 Dichondra Dr Castle Hayne, NC | 3.0–5.0 | 2.0–3.0 | 2064 | $2,768 | $1.34 | 13d | 12 | 0.45mi |
| 4605 Sidbury Crossing Dr Castle Hayne, NC | 1.0–3.0 | 1.0–2.0 | 1031 | $2,017 | $1.96 | 13d | 89 | 1.44mi |
Listing history 15 events
-
2026-06-18days on market $309,990 Active 224 DOM
-
2026-06-17days on market $309,990 Active 223 DOM
-
2026-06-16days on market $309,990 Active 222 DOM
-
2026-06-15days on market $309,990 Active 221 DOM
-
2026-06-14days on market $309,990 Active 219 DOM
-
2026-06-13days on market $309,990 Active 218 DOM
-
2026-06-10days on market $309,990 Active 216 DOM
-
2026-06-09days on market $309,990 Active 215 DOM
-
2026-06-08days on market $309,990 Active 214 DOM
-
2026-06-07days on market $309,990 Active 213 DOM
-
2026-06-05days on market $309,990 Active 210 DOM
-
2026-06-03days on market $309,990 Active 209 DOM
-
2026-06-03days on market $309,990 Active 208 DOM
-
2026-05-31days on market $309,990 Active 206 DOM
-
2026-05-30days on market $309,990 Active 205 DOM
ⓘ Source: listings_history table (triggers on properties + properties_extension) + one-shot
backfill from property_details.listing_events for pre-trigger history.
Climate risk First Street
- Flood 6/10 Major FEMA zone X (unshaded) · 68% chance over 30 yrs
- Wildfire 5/10 Major
- Heat 9/10 Extreme 7 d/yr ≥105°F today · 19 d/yr by 30 yrs out
- Wind 8/10 Severe 99% chance of damaging wind over 30 yrs
- Air quality 1/10 Low 0 unhealthy d/yr today · 0 by 30 yrs out
Nearby sold comps map
Loading sold comps map…
Walkable amenities ~0.75 mi
Loading nearby amenities…
Taxation est. · year 1
- Rental income
- $36,931
- − Mortgage interest
- −$18,454
- − Property taxes
- −$4,942
- − Insurance
- −$1,647
- − Repairs & maintenance
- −$2,955
- − Management
- −$2,955
- − Depreciation
- −$9,584
- Taxable loss
- −$3,605
- Est. tax savings @ 24.0%
- +$865
- After-tax cash flow
- $2,720/yr
For passive investors: Depreciation is non-cash, so a rental often shows a tax loss while cash-flowing — sheltering income. Rental losses are passive: they offset passive income freely, and up to $25,000/yr can offset ordinary (W-2) income if you actively participate and your MAGI is under $100k (phasing out to $0 by $150k); unused losses carry forward. On sale, claimed depreciation is recaptured at up to 25%, and gains may owe capital-gains tax (a 1031 exchange can defer both). Figures are a year-1 estimate at your 24.0% rate — not tax advice; consult a CPA.
Schools (NCES district)
- District
- New Hanover County Schools
- NCES district ID
- 3703330
- Math proficiency
- 48% ▼ -3.00%
- Reading proficiency
- 53% ▬ 0.00%
- Median HH income
- $49,406
- Composite
- 43.13/100
- National rank
- #3081
- State rank
- #61 of 178 in NC
Livability — Murraysville
- Score
- 66/100
- State rank
- #294
- US rank
- #12387
Category grades
Schools grade is shown separately in the Schools card above.
Census & demographics
- County
- New Hanover County · 232,153 people
- Metro
- Wilmington, NC
- Population (ZIP)
- 9,662
- Household income
- $72,337
- Rent vs Own
- Severe rent burden
- 110.0
Population outlook (New Hanover County) Hauer SSP2
- Today (2025)
- 259,517 people
- By 2030
- 279,586 · +7.7%
- By 2040
- 318,223 · +22.6%
- By 2050
- 354,831 · +36.7%
- By 2075
- 437,158 · +68.5%
- By 2100
- 486,769 · +87.6%
Race, ethnicity, and origin ACS 2023
- Neighborhood character
- Predominantly White (71%)
- Race & ethnicity
- White 71% Black 14% Hispanic / Latino 8% Two or more races 6%
- Hispanic origin (detail)
- Mexican 8%
- Common ancestry
- Italian 3% Slovak 3% Lithuanian 2%
- Foreign-born
- 3% · Canada
- Languages at home
- 94% English-only · Spanish 5% German/W. Germanic 1%
Political lean MEDSL · New Hanover
- 2024 margin
- Toss-up / Even · D 49.8% · R 49.1% · Other 1.1%
- 2008→2024 swing
- +2.0pp toward D · 2008: -1.4pp · 2024: 0.6pp
- All cycles
- 2024: D+0.6 2020: D+2.1 2016: R+4.1 2012: R+4.7 2008: R+1.4
Not yet ingested
- Civics
- —
Market trends
- HPI YoY
- ▼ -120.39%
- Current HPI
- 220.4084
- Rent YoY
- —
- Metro
- Wilmington, NC
- State GDP YoY
- ▲ 3.28%
- F500 in state
- 26
Industry mix (Fortune 500 HQ in NC)
| Industry | F500 HQs | Revenue |
|---|---|---|
| Financial Services | 2 | $213B |
|
||
| Retail | 2 | $95B |
|
||
| Industrial Conglomerate | 1 | $38B |
|
||
| Metals / Steel | 1 | $35B |
|
||
| Utilities | 1 | $30B |
|
||
| Industrial Machinery | 1 | $19B |
|
||
Cash-flow waterfall
monthlySold comps — $/sqft
last 12 mo · ≤1 miLoading sold comps…