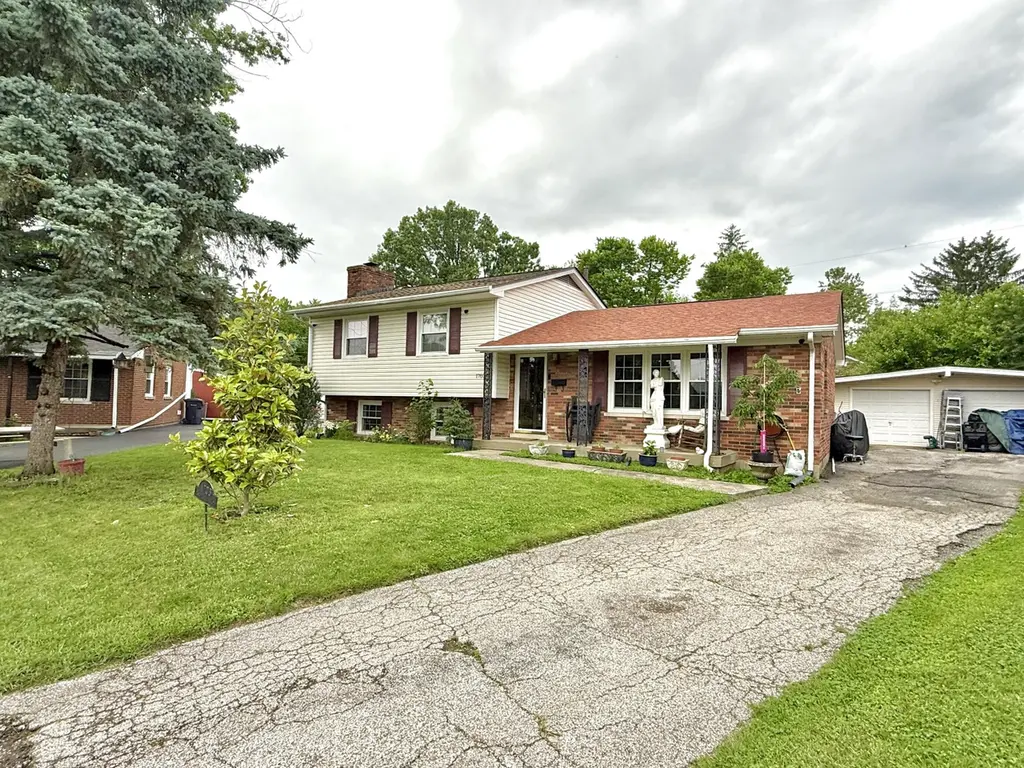
1703 New Orleans Ct
Lexington-Fayette, KY 40505
$285,000D
3 bd · 1.0 ba ·
1,752 sqft ·
Built 1963
· SingleFamily
· Active
· 26 DOM
Cashflow @ list (25.0% down · 7.5%)
Estimated rent
$2,274/mo
Mortgage (P&I)
−$1,495
Tax + insurance
−$228
HOA
−$0
Vac / Maint / Mgmt
−$477
Net cashflow
$73/mo
Annual
$879/yr
Cap rate
6.60%
Cash-on-cash
1.10%
DSCR
1.05
1% rule
0.80%
Cash to close
$79,800
Investor read
- This is a 3-bed/1.0-bath single-family listed at $285k.
- At list price, monthly cash flow is $73 ($879/yr) — positive.
- The deal already cash-flows at list — no discount required.
- To meet the 1% rule (rent ≥ 1% of price), the offer needs to be $227k (20.2% below list).
- It's been on market 26 days — a 2% lower offer ($281k) is reasonable based on typical stale-listing flexibility.
- Recommended offer: $227k (20.2% below list) — sets the bar for 1% rule.
- Local home prices are declining (-3.0%/yr); year-one equity from $2k of loan paydown is wiped out by about $9k of value loss. Plan a longer hold.
- Location reads: area grade D — affects rentability + tenant quality, not the cash-flow math above.
- Fayette County (urban): math 35% / reading 45% proficiency, ranked #27 of 165 in KY (top 16%) — families likely to look elsewhere, expect single-tenant / working-renter base with shorter leases.
- Zoned schools: Dixie Elementary Magnet School (math 29% / reading 43%, grade F, #287 of 676 statewide, top 43%, 542 students, 51% FRL); Crawford Middle School (math 15% / reading 31%, grade F, #197 of 217 statewide, top 92%, 751 students, 68% FRL); Frederick Douglass High School (math 36% / reading 42%, grade F, #51 of 254 statewide, top 21%, 1,667 students, 43% FRL).
- Market conditions: Rents rising fast (+4.3%/yr); 71 active listings in the ZIP; 3 comparable units currently listed for rent nearby; rentals at typical pace (median 16d on market — plan ~3-4 weeks tenant-placement turnaround); 1,036 units permitted in Fayette County in 2024 (542 in 5+ unit buildings).
- Fayette County population projected at +35% by 2050 — long-run rental-demand tailwind backs the buy-and-hold thesis.
- 4 sale attempts since 29y ago with the ask held roughly flat each time — persistent listings suggest the price (not the market) is what's stuck; bring a comps-based counter.
- Current owner paid $160k; list at $285k implies a 78% gain — meaningful room to come down on a strong offer.
- Cap rate 6.6% vs local median 3.8% in Lexington-Fayette — top-decile yield for the area; either an underpriced asset or a hidden risk that comps aren't pricing in. Stress-test before assuming the spread holds.
- At $2,274/mo this rent would consume 47% of the median local household income ($58k/yr) (locally 1232% of renters already pay >50% of income on rent) — very limited rent-growth headroom before tenants either downsize or default.
Questions for listing agent
- Built in 1963 — when were the roof, HVAC, electrical panel, plumbing, and water heater last replaced?
- Is there a deadline driving the sale (1031 exchange, divorce, estate, relocation)? That informs how much negotiation room exists.
- The area grade is low — what's the realistic commute time and amenity access for the typical tenant pool here? Any planned neighborhood developments (good or bad) we should know about?
- What's the average days-on-market for RENTAL listings here right now (not sales)? A rising rental-DOM trend means longer vacancies and softer asking-rent achievability than the comps imply.
- What's the recent tenant-quality profile in this submarket — average credit score on applications, eviction rate, late-payment / NSF rate, and stable-employment percentage? A property-management company in the area should have these aggregated.
- How much new for-sale + rental construction is in the pipeline within 1–3 miles? Heavy new supply typically softens prices + rents 12–24 months out; constrained supply supports both.
CashFlowRE · CFR-P19YQT3DDQCYTF
· Data 1 h ago
cashflowre.app · 2026-05-29