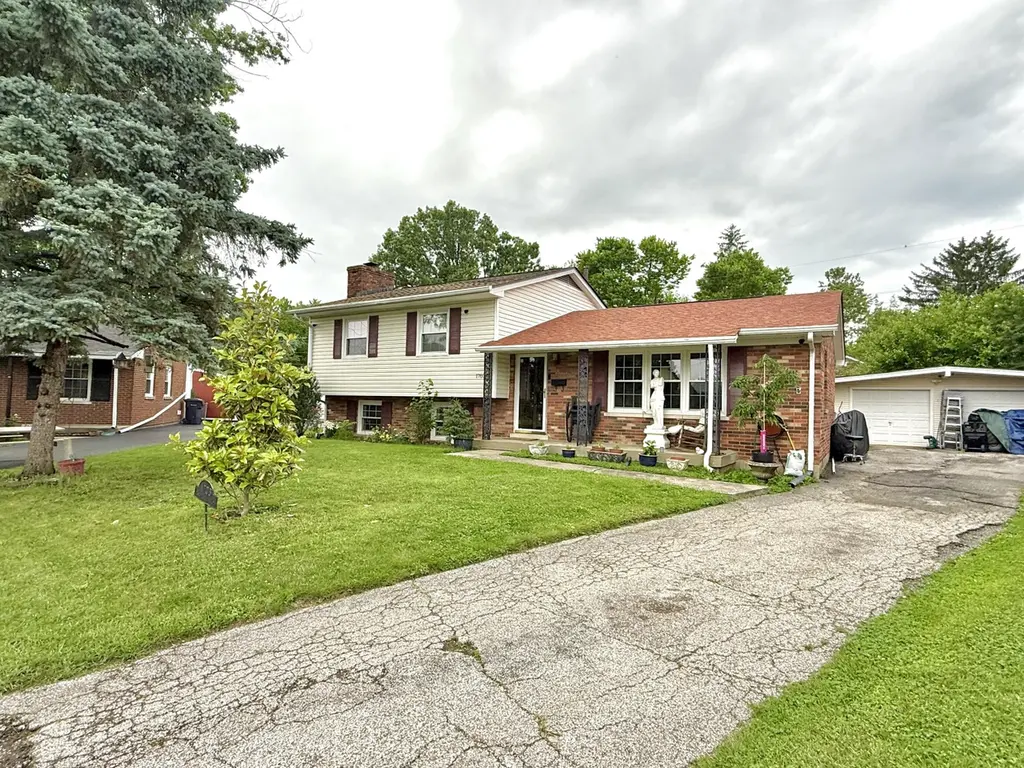
1703 New Orleans Ct · Lexington-Fayette, KY
Flood risk 1/10 · Minimal
- FEMA flood zone
- X (unshaded)
- Chance of flooding over 30 yrs
- 0.0%
- Est. flood insurance / yr
- $473 – $860
Fire risk 1/10 · Minimal
- Est. fire insurance / yr
- $839 – $1,559
Heat risk 4/10 · Minor
- Hot days now (above 101°F)
- 7 days/yr
- Hot days in 30 yrs
- 19 days/yr
Wind risk 2/10 · Minimal
- Chance of severe wind over 30 yrs
- 2.0%
Air-quality risk 2/10 · Minimal
- Unhealthy air days now
- 0 days/yr
- Unhealthy air days in 30 yrs
- 1 days/yr
Risk factors via First Street. Map © Google.
Why this score? — see what drove the D- grade
The composite is a weighted blend of 9 inputs, each scored 0–100. Each bar is that input's sub-score; the figure is the points it added to the 100-point composite (weight × sub-score).
- Cash flow +14.2/30.0
- ARV discount +5.1/15.0
- DSCR +4.3/10.0
- Rent growth +3.6/5.0
- Schools +3.4/10.0
- 1% rule +2.8/10.0
- Livability +2.5/5.0
- Condition / age +2.5/5.0
- Appreciation +0.0/10.0
$289,900
🖨 Deal sheet (PDF) 📄 Offer letter ✓ Due diligence
Listing remarks MLS
Price Reduction! Spacious split level home in the heart of Dixie Plantation. This home has 3 bedrooms, 1 bathroom, hardwood flooring, formal dining room, oversized 2 car detached garage, large level backyard and a stones throw from Dixie Elementary. The finished walk out basement is complete with a wood burning insert and separate storage and laundry rooms. There are several updates to mention; the windows and doors were replaced 2012-2013, Vinyl siding replaced 2011, water heater was replaced 4 years ago, and the HVAC system per the owner is 2 to 3 years old. Home being sold As-Is inspections welcome. Both sheds in the back yard convey. Seller is offering $3,000 credit for painting.
Key facts
- Hardwood flooring
- Walk-out access
- Private cul de sac
Tags
Property features AI
Exterior
- Parking: Detached garage that faces the front; Property has a garage
- Utilities: Public water; Public sewer; Electricity connected; Natural gas connected; Sewer connected; Water connected
- Home design: House; Multi/split levels; Built-up living area listed (total building area available)
- Construction: Brick veneer and vinyl siding exterior; Shingle roof; Slab foundation
- Exterior features: Few trees on the lot; Chain link fencing
Interior
- Kitchen: Dishwasher; Range
- Bedrooms: Total rooms: 9 (includes bedrooms and living spaces)
- Flooring: Hardwood; Vinyl
- Bathrooms: 1 full bathroom
- Heating & cooling: Forced air heating (natural gas); Electric cooling
- Interior features: Entrance foyer; Ceiling fans; Finished basement space (below-grade area finished); Crawl space
- Laundry & utility: Washer hookup on lower level; Electric dryer hookup on lower level
Neighborhood map
What this means for you Summary
Snapshot
- This is a 3-bed/1.0-bath single-family listed at $290k.
Deal economics
- At list price, monthly cash flow is $45 ($546/yr) — positive.
- The deal already cash-flows at list — no discount required.
- To meet the 1% rule (rent ≥ 1% of price), the offer needs to be $227k (21.6% below list).
- Recommended offer: $227k (21.6% below list) — sets the bar for 1% rule.
- Cap rate 6.5% vs local median 3.8% in Lexington-Fayette — top-decile yield for the area; either an underpriced asset or a hidden risk that comps aren't pricing in. Stress-test before assuming the spread holds.
Location & tenants
- Location reads: area grade D — affects rentability + tenant quality, not the cash-flow math above.
- Fayette County (urban): math 35% / reading 45% proficiency, ranked #27 of 165 in KY (top 16%) — families likely to look elsewhere, expect single-tenant / working-renter base with shorter leases.
- Zoned schools: Dixie Elementary Magnet School (math 29% / reading 43%, grade F, #287 of 676 statewide, top 43%, 542 students, 51% FRL); Crawford Middle School (math 15% / reading 31%, grade F, #197 of 217 statewide, top 92%, 751 students, 68% FRL); Frederick Douglass High School (math 36% / reading 42%, grade F, #51 of 254 statewide, top 21%, 1,667 students, 43% FRL).
- Market conditions: Rents rising fast (+4.3%/yr); 68 active listings in the ZIP; 3 comparable units currently listed for rent nearby; rentals at typical pace (median 15d on market — plan ~3-4 weeks tenant-placement turnaround); 1,036 units permitted in Fayette County in 2024 (542 in 5+ unit buildings).
- At $2,274/mo this rent would consume 47% of the median local household income ($58k/yr) (locally 1232% of renters already pay >50% of income on rent) — very limited rent-growth headroom before tenants either downsize or default.
Forward outlook
- Local home prices are declining (-3.0%/yr); year-one equity from $2k of loan paydown is wiped out by about $9k of value loss. Plan a longer hold.
- Fayette County population projected at +35% by 2050 — long-run rental-demand tailwind backs the buy-and-hold thesis.
Negotiation context
- It's been on market 23 days — a 2% lower offer ($286k) is reasonable based on typical stale-listing flexibility.
- 4 sale attempts since 29y ago with the ask held roughly flat each time — persistent listings suggest the price (not the market) is what's stuck; bring a comps-based counter.
- Current owner paid $160k; list at $290k implies a 81% gain — meaningful room to come down on a strong offer.
Questions for the listing agent
- Built in 1963 — when were the roof, HVAC, electrical panel, plumbing, and water heater last replaced?
- Is there a deadline driving the sale (1031 exchange, divorce, estate, relocation)? That informs how much negotiation room exists.
- The area grade is low — what's the realistic commute time and amenity access for the typical tenant pool here? Any planned neighborhood developments (good or bad) we should know about?
- What's the average days-on-market for RENTAL listings here right now (not sales)? A rising rental-DOM trend means longer vacancies and softer asking-rent achievability than the comps imply.
- What's the recent tenant-quality profile in this submarket — average credit score on applications, eviction rate, late-payment / NSF rate, and stable-employment percentage? A property-management company in the area should have these aggregated.
- How much new for-sale + rental construction is in the pipeline within 1–3 miles? Heavy new supply typically softens prices + rents 12–24 months out; constrained supply supports both.
Investment metrics
- 1% rule
- 0.78% ✗
- Cap rate
- 6.48%
- Cash-on-cash
- 0.67%
- DSCR
- 1.03
- GRM
- 10.6
CMA / ARV
- ARV (on-the-fly)
- $275,064
- Comps found
- 12
Show comp detail 12 sales within ~0.75 mi
| Address | Dist | Beds/Ba | Sqft | Sold | Price | $/sf | Match |
|---|---|---|---|---|---|---|---|
| 1708 Biloxi Ct | 0.09mi | 4/2.0 (+1) | 1,733 (-1%) | 7mo | $295,000 | $170 | 79 |
| 1613 Fort Sumter Dr | 0.39mi | 3/2.0 | 1,740 (-1%) | 3mo | $300,500 | $173 | 74 |
| 1901 Greenleaf Dr | 0.46mi | 3/1.0 | 1,822 (+4%) | 5mo | $245,000 | $134 | 68 |
| 1601 Athens Ct | 0.38mi | 3/1.5 | 1,859 (+6%) | 9mo | $170,000 | $91 | 63 |
| 2081 Call Dr | 0.58mi | 3/2.5 | 1,704 (-3%) | 2mo | $333,000 | $195 | 60 |
| 1706 Sarasota Ct | 0.18mi | 4/1.0 (+1) | 1,550 (-12%) | 9mo | $225,000 | $145 | 60 |
| 603 Ivy Ct | 0.52mi | 4/1.0 (+1) | 1,610 (-8%) | 6mo | $258,000 | $160 | 52 |
| 1655 Kilkenny Dr | 0.64mi | 3/1.5 | 1,593 (-9%) | 5mo | $280,000 | $176 | 48 |
| 685 Hi Crest Dr | 0.58mi | 3/1.5 | 1,924 (+10%) | 8mo | $278,000 | $144 | 48 |
| 1824 Endon Dr | 0.56mi | 4/2.0 (+1) | 1,621 (-8%) | 8mo | $255,000 | $157 | 46 |
| 1984 Brynell Dr | 0.65mi | 3/1.0 | 1,950 (+11%) | 10mo | $212,000 | $109 | 42 |
| 1994 Brynell Dr | 0.65mi | 3/1.5 | 1,491 (-15%) | 5mo | $174,900 | $117 | 39 |
Match score weights: distance 35% · size 25% · config 20% · recency 20%. Top-matched comps best support the ARV.
Projected returns pro-forma
-3.0% appreciation · 4.31% rent growth · sell at horizon
- IRR
- -14.0%
- Equity multiple
- 0.49×
- Total profit
- $-41,164
- Equity at exit
- $43,225
- IRR
- -3.5%
- Equity multiple
- 0.76×
- Total profit
- $-19,811
- Equity at exit
- $25,065
Cash invested: $81,172 (down + closing). Projections, not guarantees.
Landlord ↔ Tenant lean methodology
- Overall (STATE)
- 83 Strongly Landlord-Friendly
- State Kentucky
- 83 Strongly Landlord-Friendly · R+16
- County
- — inherits STATE
- City
- — inherits STATE
ZIP-level market 40505
- Rents YoY
- 4.3%
- Active inventory
- 68
- Price-to-rent
- 10.6×
Monthly cashflow live
- Estimated rent
- $2,274 medium interval (Pro) →
- Mortgage (P&I)
- −$1,520
- Tax from tax record
- −$110 /mo · $1,316/yr
- Insurance
- −$121
- HOA
- −$0
- Vacancy / Maint / Mgmt
- −$477
- Net cashflow
- $45
Break-even live
Sensitivity live
| Price | -10% $210 | -5% $128 | +0% $45 | +5% $-37 | +10% $-119 |
|---|---|---|---|---|---|
| Rent | -10% $-134 | -5% $-44 | +0% $45 | +5% $135 | +10% $225 |
| Rate | -1.0pp $191 | -0.5pp $119 | base $45 | +0.5pp $-30 | +1.0pp $-106 |
UW: 25.0% down · 7.5% · 30yr · 1.5% tax · 5.0% vac · 8.0% maint · 8.0% mgmt
Financing live
Cash to close
- Down payment
- $72,475
- Closing costs
- $8,697
- Reserves months
- —
- Total cash needed
- —
Loan-product check · same deal, 3 products live
Conventional
25% down · 7.5% · 30yr
- Down + closing
- —
- Monthly P&I
- —
- Monthly cashflow
- —
- DSCR
- —
- Eligible?
- —
Personal DTI + credit; lowest rate.
DSCR
20% down · 8.5% · 30yr
- Down + closing
- —
- Monthly P&I
- —
- Monthly cashflow
- —
- DSCR
- —
- Eligible?
- —
No personal income docs; deal must DSCR.
Hard money
10% down · 12.0% · 12mo
- Down + closing
- —
- Monthly P&I
- —
- Monthly cashflow
- —
- DSCR
- —
- Eligible?
- —
Short-term bridge; refi at stabilization.
Rent comps 3 comps
| Address | Beds | Baths | Sqft | Rent | $/sqft | DOM | Units | Dist |
|---|---|---|---|---|---|---|---|---|
| 1809 Meeting St Lexington, KY | 1.0–3.0 | 1.0–2.0 | 977 | $2,003 | $2.05 | 15d | 22 | 0.88mi |
| 2151 Meeting St Lexington, KY | 3.0 | 1.0–2.0 | 977 | $2,237 | $2.29 | 15d | 39 | 1.06mi |
| 1424 Maybank Park Lexington, KY | 4.0 | 3.0 | 2081 | $3,250 | $1.56 | 24d | 1 | 1.30mi |
Listing history 29 events
-
2026-06-18days on market $289,900 Active 23 DOM
-
2026-06-17days on market $289,900 Active 22 DOM
-
2026-06-16days on market $289,900 Active 21 DOM
-
2026-06-15days on market $289,900 Active 20 DOM
-
2026-06-14days on market $289,900 Active 18 DOM
-
2026-06-13days on market $289,900 Active 17 DOM
-
2026-06-10days on market $289,900 Active 15 DOM
-
2026-06-09days on market $289,900 Active 14 DOM
-
2026-06-09price $289,900 Active 13 DOM
-
2026-06-08days on market $299,000 Active 13 DOM
-
2026-06-07days on market $299,000 Active 12 DOM
-
2026-06-05days on market $299,000 Active 9 DOM
-
2026-06-03days on market $299,000 Active 8 DOM
-
2026-06-02days on market $299,000 Active 7 DOM
-
2026-06-01days on market $299,000 Active 6 DOM
-
2026-05-31days on market $299,000 Active 5 DOM
-
2026-05-31days on market $299,000 Active 4 DOM
-
2026-05-26$299,000 Active
-
2021-02-25soldstatus $160,000
-
2021-02-19soldstatus $160,000 Sold 692-char remark
Show marketing remark (692 chars)
Price Reduction! Spacious split level home in the heart of Dixie Plantation. This home has 3 bedrooms, 1 bathroom, hardwood flooring, formal dining room, oversized 2 car detached garage, large level backyard and a stones throw from Dixie Elementary. The finished walk out basement is complete with a wood burning insert and separate storage and laundry rooms. There are several updates to mention; the windows and doors were replaced 2012-2013, Vinyl siding replaced 2011, water heater was replaced 4 years ago, and the HVAC system per the owner is 2 to 3 years old. Home being sold As-Is inspections welcome. Both sheds in the back yard convey. Seller is offering $3,000 credit for painting.
-
2021-01-17status Pending 692-char remark
Show marketing remark (692 chars)
Price Reduction! Spacious split level home in the heart of Dixie Plantation. This home has 3 bedrooms, 1 bathroom, hardwood flooring, formal dining room, oversized 2 car detached garage, large level backyard and a stones throw from Dixie Elementary. The finished walk out basement is complete with a wood burning insert and separate storage and laundry rooms. There are several updates to mention; the windows and doors were replaced 2012-2013, Vinyl siding replaced 2011, water heater was replaced 4 years ago, and the HVAC system per the owner is 2 to 3 years old. Home being sold As-Is inspections welcome. Both sheds in the back yard convey. Seller is offering $3,000 credit for painting.
-
2021-01-02price $174,900 692-char remark
Show marketing remark (692 chars)
Price Reduction! Spacious split level home in the heart of Dixie Plantation. This home has 3 bedrooms, 1 bathroom, hardwood flooring, formal dining room, oversized 2 car detached garage, large level backyard and a stones throw from Dixie Elementary. The finished walk out basement is complete with a wood burning insert and separate storage and laundry rooms. There are several updates to mention; the windows and doors were replaced 2012-2013, Vinyl siding replaced 2011, water heater was replaced 4 years ago, and the HVAC system per the owner is 2 to 3 years old. Home being sold As-Is inspections welcome. Both sheds in the back yard convey. Seller is offering $3,000 credit for painting.
-
2020-12-10$179,900 Active 692-char remark
Show marketing remark (692 chars)
Price Reduction! Spacious split level home in the heart of Dixie Plantation. This home has 3 bedrooms, 1 bathroom, hardwood flooring, formal dining room, oversized 2 car detached garage, large level backyard and a stones throw from Dixie Elementary. The finished walk out basement is complete with a wood burning insert and separate storage and laundry rooms. There are several updates to mention; the windows and doors were replaced 2012-2013, Vinyl siding replaced 2011, water heater was replaced 4 years ago, and the HVAC system per the owner is 2 to 3 years old. Home being sold As-Is inspections welcome. Both sheds in the back yard convey. Seller is offering $3,000 credit for painting.
-
2000-03-24soldstatus $96,500
-
2000-02-24historical
-
2000-01-22$96,500
-
1998-05-22soldstatus $79,000
-
1998-04-25historical
-
1997-11-19$79,900
ⓘ Source: listings_history table (triggers on properties + properties_extension) + one-shot
backfill from property_details.listing_events for pre-trigger history.
Tax reassessment forecast KY · Resets to sale price
- Current annual tax
- $1,316 · $110/mo
- Projected year-2 tax
- $2,493 · $208/mo
- Expected delta
- +$1,177/yr (+$98/mo · 89.4%)
ⓘ Screening estimate from a state-policy table — verify with the county assessor before closing.
Climate risk First Street
- Flood 1/10 Low FEMA zone X (unshaded) · 0% chance over 30 yrs
- Wildfire 1/10 Low
- Heat 4/10 Moderate 7 d/yr ≥101°F today · 19 d/yr by 30 yrs out
- Wind 2/10 Low 2% chance of damaging wind over 30 yrs
- Air quality 2/10 Low 0 unhealthy d/yr today · 1 by 30 yrs out
Nearby sold comps map
Loading sold comps map…
Walkable amenities ~0.75 mi
Loading nearby amenities…
Taxation est. · year 1
- Rental income
- $27,285
- − Mortgage interest
- −$16,239
- − Property taxes
- −$1,316
- − Insurance
- −$1,450
- − Repairs & maintenance
- −$2,183
- − Management
- −$2,183
- − Depreciation
- −$8,433
- Taxable loss
- −$4,519
- Est. tax savings @ 24.0%
- +$1,085
- After-tax cash flow
- $1,630/yr
For passive investors: Depreciation is non-cash, so a rental often shows a tax loss while cash-flowing — sheltering income. Rental losses are passive: they offset passive income freely, and up to $25,000/yr can offset ordinary (W-2) income if you actively participate and your MAGI is under $100k (phasing out to $0 by $150k); unused losses carry forward. On sale, claimed depreciation is recaptured at up to 25%, and gains may owe capital-gains tax (a 1031 exchange can defer both). Figures are a year-1 estimate at your 24.0% rate — not tax advice; consult a CPA.
Schools (NCES district)
- District
- Fayette County
- NCES district ID
- 2101860
- Math proficiency
- 35% ▼ -16.00%
- Reading proficiency
- 45% ▼ -13.00%
- Median HH income
- $49,245
- Composite
- 34.38/100
- National rank
- #5211
- State rank
- #27 of 165 in KY
Livability — Lexington-Fayette
No livability data for this city. (Only ~50 U.S. cities are tracked.)
Census & demographics
- Census place
- Lexington-Fayette, KY
- County
- Fayette County · 317,143 people
- City population
- 321,882
- Metro
- Lexington-Fayette, KY
- Population (ZIP)
- 25,594
- Household income
- $58,206
- Rent vs Own
- Severe rent burden
- 1232.0
Population outlook (Fayette County) Hauer SSP2
- Today (2025)
- 363,454 people
- By 2030
- 388,270 · +6.8%
- By 2040
- 438,688 · +20.7%
- By 2050
- 490,667 · +35.0%
- By 2075
- 625,394 · +72.1%
- By 2100
- 721,354 · +98.5%
Race, ethnicity, and origin ACS 2023
- Neighborhood character
- Predominantly White (65%)
- Race & ethnicity
- White 65% Black 17% Hispanic / Latino 13% Two or more races 10%
- Hispanic origin (detail)
- Mexican 9% Cuban 2%
- Common ancestry
- Italian 3% Serbian 2% Slovak 1%
- Foreign-born
- 7% · Canada
- Languages at home
- 89% English-only · Spanish 10%
Political lean MEDSL · Fayette
- 2024 margin
- D (+18.1) · D 58.0% · R 39.9% · Other 2.1%
- 2008→2024 swing
- +13.3pp toward D · 2008: 4.8pp · 2024: 18.1pp
- All cycles
- 2024: D+18.1 2020: D+20.8 2016: D+9.5 2012: D+1.0 2008: D+4.8
Not yet ingested
- Civics
- —
Market trends
- HPI YoY
- ▼ -191.31%
- Current HPI
- 249.2066
- Rent YoY
- ▲ 4.31%
- Metro
- Lexington-Fayette, KY
- State GDP YoY
- ▲ 1.81%
- F500 in state
- 4
Industry mix (Fortune 500 HQ in KY)
| Industry | F500 HQs | Revenue |
|---|---|---|
| Healthcare | 1 | $118B |
|
||
| Food / Beverage | 1 | $7B |
|
||
Price history
+274.2% since first listed12 events — show timeline
- 2026-05-26 Listed $299,000 ImagineMLS
- 2021-02-25 Sold (Public Records) $160,000 Public Records
- 2021-02-19 Sold (MLS) $160,000 ImagineMLS
- 2021-01-17 Pending — ImagineMLS
- 2021-01-02 Price Changed $174,900 ImagineMLS
- 2020-12-10 Listed $179,900 ImagineMLS
- 2000-03-24 Sold (MLS) $96,500 ImagineMLS
- 2000-02-24 Listing Removed — ImagineMLS
- 2000-01-22 Listed $96,500 ImagineMLS
- 1998-05-22 Sold (MLS) $79,000 ImagineMLS
- 1998-04-25 Listing Removed — ImagineMLS
- 1997-11-19 Listed $79,900 ImagineMLS
Property tax history
+1.8%/yrLatest (2015): $1,316 · +1.8% YoY. Source: county tax records.
Cash-flow waterfall
monthlySold comps — $/sqft
last 12 mo · ≤1 miLoading sold comps…