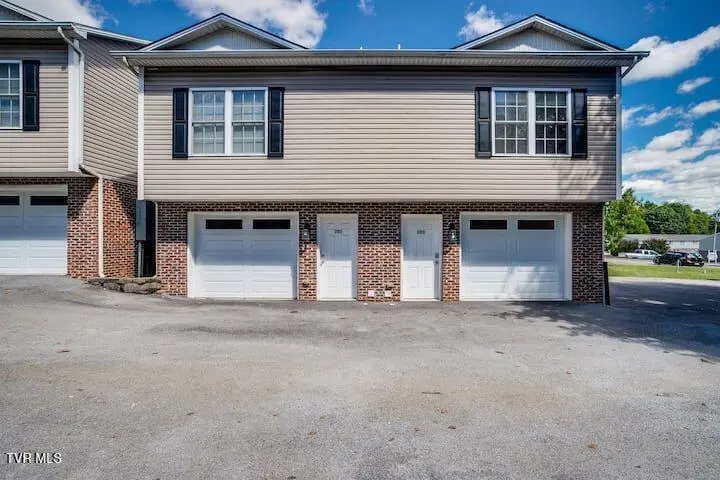
169 Grande Ave #200
Johnson City, TN 37601
$2,500D+
2 bd · 2.0 ba ·
1,080 sqft ·
Built 2007
· Townhouse
· Active
· 280 DOM
Cashflow @ list (25.0% down · 7.5%)
Estimated rent
$1,511/mo
Mortgage (P&I)
−$13
Tax + insurance
−$4
HOA
−$0
Vac / Maint / Mgmt
−$317
Net cashflow
$1,177/mo
Annual
$14,121/yr
Cap rate
571.12%
Cash-on-cash
2017.25%
DSCR
90.76
1% rule
60.46%
Cash to close
$700
Investor read
- This is a 2-bed/2.0-bath townhouse listed at $2k.
- At list price, monthly cash flow is $1k ($14k/yr) — positive.
- The deal already cash-flows at list — no discount required.
- Meets the 1% rule at list price ($2k rent vs $2k).
- It's been on market 280 days — a 12% lower offer ($2k) is reasonable based on typical stale-listing flexibility.
- Recommended offer: $2k (12.0% below list) — sets the bar for market timing.
- Local home prices are declining (-3.0%/yr); year-one equity from $17 of loan paydown is wiped out by about $75 of value loss. Plan a longer hold.
- Location reads 76/100 on livability (#8 in TN, #3,349 nationally) — a middle-class / working-renter tenant base. Strengths: amenities A+, cost of living A+, health & safety A; Watch: crime D, commute F, employment F.
- Johnson City (urban): math 46% / reading 47% proficiency, ranked #9 of 139 in TN (top 6%) — families likely to look elsewhere, expect single-tenant / working-renter base with shorter leases.
- Market conditions: Rents rising fast (+4.9%/yr); 206 active listings in the ZIP; 32 comparable units currently listed for rent nearby; rentals at typical pace (median 21d on market — plan ~3-4 weeks tenant-placement turnaround); 41% of comp listings sitting > 30 days — soft ceiling on asking rent; 1,155 units permitted in Washington County in 2024 (437 in 5+ unit buildings).
- Washington County population projected at +9% by 2050 — modest demand growth; plan on rents tracking national, not racing it.
- At projected returns (-3.0% appreciation + 4.9% rent growth), your $700 cash investment doubles in ~1 year — after that, you're playing with house money.
- Cap rate 571.1% vs local median 3.1% in Johnson City — top-decile yield for the area; either an underpriced asset or a hidden risk that comps aren't pricing in. Stress-test before assuming the spread holds.
- This rent runs 36% of the median local income ($51k/yr) — at the standard rent-burdened threshold; future hikes will face affordability resistance.
Questions for listing agent
- It's been on market 280 days. Have you received any prior offers? Is the seller open to a 12% concession, seller financing, or rate buy-down credit?
- Why hasn't it sold? Are there any deal-killer items the seller is aware of (foundation, flood, title, zoning, code violations)?
- Is there a deadline driving the sale (1031 exchange, divorce, estate, relocation)? That informs how much negotiation room exists.
- Crime grade is D in this area — have there been break-ins, vandalism, or insurance claims at this property in the last 3 years? What carrier currently insures it and at what premium?
- The area grade is low — what's the realistic commute time and amenity access for the typical tenant pool here? Any planned neighborhood developments (good or bad) we should know about?
- What's the average days-on-market for RENTAL listings here right now (not sales)? A rising rental-DOM trend means longer vacancies and softer asking-rent achievability than the comps imply.
- What's the recent tenant-quality profile in this submarket — average credit score on applications, eviction rate, late-payment / NSF rate, and stable-employment percentage? A property-management company in the area should have these aggregated.
- How much new for-sale + rental construction is in the pipeline within 1–3 miles? Heavy new supply typically softens prices + rents 12–24 months out; constrained supply supports both.
CashFlowRE · CFR-P1MZ3ZFDKDNENW
· Data 1 day ago
cashflowre.app · 2026-05-29