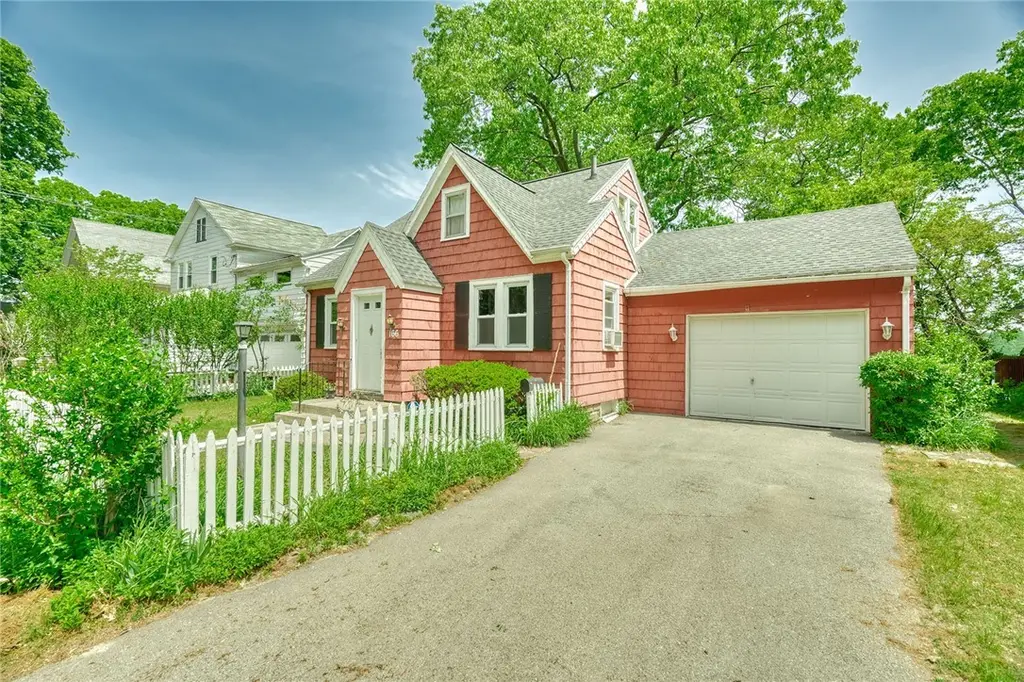
166 Pleasant Ave
Irondequoit, NY 14622
$129,900C-
2 bd · 1.5 ba ·
1,148 sqft ·
Built 1935
· SingleFamily
· Pending
· 5 DOM
Cashflow @ list (25.0% down · 7.5%)
Estimated rent
$1,524/mo
Mortgage (P&I)
−$681
Tax + insurance
−$540
HOA
−$0
Vac / Maint / Mgmt
−$320
Net cashflow
$-18/mo
Annual
$-215/yr
Cap rate
6.13%
Cash-on-cash
-0.59%
DSCR
0.97
1% rule
1.17%
Cash to close
$36,372
Investor read
- This is a 2-bed/1.5-bath single-family listed at $130k.
- At list price, monthly cash flow is $-18 ($-215/yr) — negative.
- To cash-flow at today's rent, offer at most $127k (2.4% below list).
- Meets the 1% rule at list price ($2k rent vs $130k).
- Only 5 days on market — expect competitive offers; lowballing is unlikely to land.
- Recommended offer: $127k (2.4% below list) — sets the bar for cash-flow.
- Local home prices are declining (-3.0%/yr); year-one equity from $898 of loan paydown is wiped out by about $4k of value loss. Plan a longer hold.
- Location reads 81/100 on livability (#92 in NY, #1,414 nationally) — a professional / high-income tenant draw. Strengths: housing A+, health & safety A+, crime B+; Watch: amenities F.
- East Irondequoit Central School District (suburban): math 40% / reading 47% proficiency, ranked #475 of 590 in NY (top 80%) — families likely to look elsewhere, expect single-tenant / working-renter base with shorter leases.
- Zoned schools: Ivan L Green Primary School (328 students, 58% FRL); East Irondequoit Middle School (math 20% / reading 36%, grade F, #573 of 729 statewide, top 79%, 676 students, 61% FRL); Eastridge Senior High School (math 93% / reading 82%, grade A, #304 of 1,100 statewide, top 28%, 850 students, 56% FRL).
- Zoned-school proficiency averages 58% at this address vs 44% district-wide (+14 pts) — the actual schools serving this property are materially stronger than the East Irondequoit Central School District average implies; a family-tenant draw the district grade alone would hide.
- Watch-outs: property tax is 4.5% of price; built in 1935 — expect roof / HVAC / electrical / plumbing capex.
- Market conditions: 48 active listings in the ZIP; solid renter incomes; 1,169 units permitted in Monroe County in 2024 (591 in 5+ unit buildings).
- Monroe County population projected to shrink 6% by 2050 — rents likely to lag national; underwrite the cash flow, not the appreciation.
- Cap rate 6.1% vs local median 4.5% in Irondequoit — top-decile yield for the area; either an underpriced asset or a hidden risk that comps aren't pricing in. Stress-test before assuming the spread holds.
Questions for listing agent
- What do current leases actually rent for vs. the listed asking? Can we see a recent rent roll and the last 12 months of T-12 income?
- Built in 1935 — when were the roof, HVAC, electrical panel, plumbing, and water heater last replaced?
- Property tax is high relative to price — has the assessment been appealed recently, and will the sale trigger a re-assessment?
- Is there a deadline driving the sale (1031 exchange, divorce, estate, relocation)? That informs how much negotiation room exists.
- Schools are B-rated — typically a magnet for longer-tenancy family renters. What's the average tenant stay here, and is there a school-zone premium baked into asking?
- What's the average days-on-market for RENTAL listings here right now (not sales)? A rising rental-DOM trend means longer vacancies and softer asking-rent achievability than the comps imply.
- What's the recent tenant-quality profile in this submarket — average credit score on applications, eviction rate, late-payment / NSF rate, and stable-employment percentage? A property-management company in the area should have these aggregated.
- How much new for-sale + rental construction is in the pipeline within 1–3 miles? Heavy new supply typically softens prices + rents 12–24 months out; constrained supply supports both.
CashFlowRE · CFR-P2M6J7E3T31A2X
· Data 1 week ago
cashflowre.app · 2026-05-29