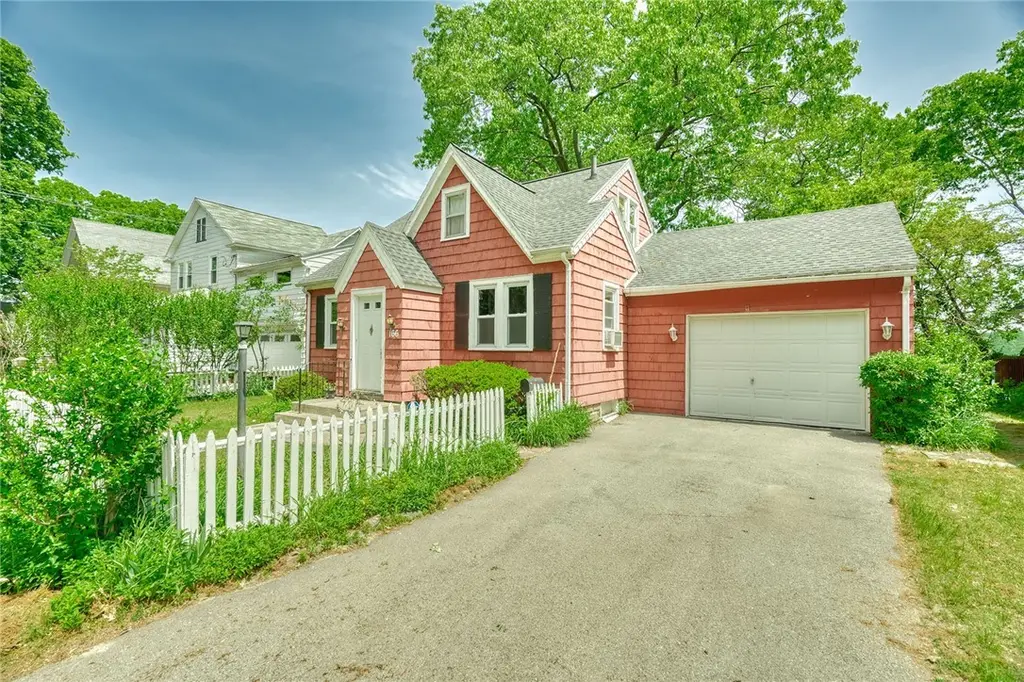
166 Pleasant Ave · Irondequoit, NY
Flood risk 1/10 · Minimal
- FEMA flood zone
- X (unshaded)
- Chance of flooding over 30 yrs
- 0.0%
- Est. flood insurance / yr
- $473 – $860
Fire risk 1/10 · Minimal
- Est. fire insurance / yr
- $691 – $1,283
Heat risk 2/10 · Minimal
- Hot days now (above 96°F)
- 7 days/yr
- Hot days in 30 yrs
- 15 days/yr
Wind risk 1/10 · Minimal
- Chance of severe wind over 30 yrs
- —
Air-quality risk 2/10 · Minimal
- Unhealthy air days now
- 1 days/yr
- Unhealthy air days in 30 yrs
- 2 days/yr
Risk factors via First Street. Map © Google.
Why this score? — see what drove the C- grade
The composite is a weighted blend of 9 inputs, each scored 0–100. Each bar is that input's sub-score; the figure is the points it added to the 100-point composite (weight × sub-score).
- ARV discount +15.0/15.0
- Cash flow +12.5/30.0
- 1% rule +6.7/10.0
- Livability +4.0/5.0
- DSCR +3.7/10.0
- Schools +3.7/10.0
- Rent growth +2.5/5.0
- Condition / age +2.5/5.0
- Appreciation +0.0/10.0
$129,900
🖨 Deal sheet (PDF) 📄 Offer letter ✓ Due diligence
Listing remarks
Opportunity knocks in one of Irondequoit’s most unique bay and lake lifestyle locations! This Cape Cod style home offers 2 bedrooms, 1.5 baths, an attached garage, full basement, and a flexible layout with plenty of upside for the right buyer. The highlight is the 3-season porch overlooking Irondequoit Bay, where you can enjoy peaceful water views and take in the natural setting that makes this area so special. Inside, the home offers a first-floor bedroom, living room, eat-in kitchen, second-floor bedroom, half bath, and an additional flexible space that could make a great office, hobby area, guest space, or potential 3rd bedroom option depending on your needs. Major features include
Key facts
- Hardwood flooring
- 3 season porch
- Natural setting
Tags
Property features AI
Exterior
- Parking: Attached garage; Approximately 1.5 garage spaces
- Utilities: Public water connected; Sewer connected; Electricity connected (circuit breakers); High-speed internet available; Cable available
- Home design: 2-story existing home; Resale property; Block foundation; Shingle roof; Wood siding; Home faces unspecified direction
- Construction: Wood siding construction; Copper plumbing; Block foundation; Shingle roof; Built as existing (year built details: existing)
- Exterior features: Blacktop driveway; Bay front on Irondequoit Bay; Near public transit; Rectangular residential lot (60 x 140)
Interior
- Kitchen: Dishwasher; Gas oven; Gas range; Refrigerator
- Bedrooms: One main-level bedroom
- Flooring: Carpet; Hardwood; Resilient flooring; Tile; Varied flooring
- Bathrooms: One full bathroom; One half bathroom
- Heating & cooling: Gas forced-air heating
- Interior features: Eat-in kitchen; Separate/formal living room; Sunroom / Florida room; Programmable thermostat; Thermal windows; Full walk-up basement with exterior entry
- Laundry & utility: Laundry in basement; Gas water heater
Neighborhood map
What this means for you Summary
Snapshot
- This is a 2-bed/1.5-bath single-family listed at $130k.
Deal economics
- At list price, monthly cash flow is $-18 ($-215/yr) — negative.
- To cash-flow at today's rent, offer at most $127k (2.4% below list).
- Meets the 1% rule at list price ($2k rent vs $130k).
- Recommended offer: $127k (2.4% below list) — sets the bar for cash-flow.
- Cap rate 6.1% vs local median 4.5% in Irondequoit — top-decile yield for the area; either an underpriced asset or a hidden risk that comps aren't pricing in. Stress-test before assuming the spread holds.
Location & tenants
- Location reads 81/100 on livability (#92 in NY, #1,414 nationally) — a professional / high-income tenant draw. Strengths: housing A+, health & safety A+, crime B+; Watch: amenities F.
- East Irondequoit Central School District (suburban): math 40% / reading 47% proficiency, ranked #475 of 590 in NY (top 80%) — families likely to look elsewhere, expect single-tenant / working-renter base with shorter leases.
- Zoned schools: Ivan L Green Primary School (328 students, 58% FRL); East Irondequoit Middle School (math 20% / reading 36%, grade F, #573 of 729 statewide, top 79%, 676 students, 61% FRL); Eastridge Senior High School (math 93% / reading 82%, grade A, #304 of 1,100 statewide, top 28%, 850 students, 56% FRL).
- Zoned-school proficiency averages 58% at this address vs 44% district-wide (+14 pts) — the actual schools serving this property are materially stronger than the East Irondequoit Central School District average implies; a family-tenant draw the district grade alone would hide.
- Market conditions: 48 active listings in the ZIP; solid renter incomes; 1,169 units permitted in Monroe County in 2024 (591 in 5+ unit buildings).
Forward outlook
- Local home prices are declining (-3.0%/yr); year-one equity from $898 of loan paydown is wiped out by about $4k of value loss. Plan a longer hold.
- Monroe County population projected to shrink 6% by 2050 — rents likely to lag national; underwrite the cash flow, not the appreciation.
Negotiation context
- Only 5 days on market — expect competitive offers; lowballing is unlikely to land.
Risks & watch-outs
- Watch-outs: property tax is 4.5% of price; built in 1935 — expect roof / HVAC / electrical / plumbing capex.
Questions for the listing agent
- What do current leases actually rent for vs. the listed asking? Can we see a recent rent roll and the last 12 months of T-12 income?
- Built in 1935 — when were the roof, HVAC, electrical panel, plumbing, and water heater last replaced?
- Property tax is high relative to price — has the assessment been appealed recently, and will the sale trigger a re-assessment?
- Is there a deadline driving the sale (1031 exchange, divorce, estate, relocation)? That informs how much negotiation room exists.
- Schools are B-rated — typically a magnet for longer-tenancy family renters. What's the average tenant stay here, and is there a school-zone premium baked into asking?
- What's the average days-on-market for RENTAL listings here right now (not sales)? A rising rental-DOM trend means longer vacancies and softer asking-rent achievability than the comps imply.
- What's the recent tenant-quality profile in this submarket — average credit score on applications, eviction rate, late-payment / NSF rate, and stable-employment percentage? A property-management company in the area should have these aggregated.
- How much new for-sale + rental construction is in the pipeline within 1–3 miles? Heavy new supply typically softens prices + rents 12–24 months out; constrained supply supports both.
Investment metrics
- 1% rule
- 1.17% ✓
- Cap rate
- 6.13%
- Cash-on-cash
- -0.59%
- DSCR
- 0.97
- GRM
- 7.1
CMA / ARV
- ARV (on-the-fly)
- $218,120
- Comps found
- 12
Show comp detail 12 sales within ~0.75 mi
| Address | Dist | Beds/Ba | Sqft | Sold | Price | $/sf | Match |
|---|---|---|---|---|---|---|---|
| 226 Peart Ave | 0.22mi | 3/1.5 (+1) | 1,174 (+2%) | 5mo | $220,000 | $187 | 77 |
| 260 Point Pleasant Rd | 0.04mi | 3/2.5 (+1) | 1,264 (+10%) | 4mo | $365,000 | $289 | 69 |
| 256 Breezeway Dr | 0.43mi | 2/2.0 | 1,072 (-7%) | 1mo | $177,000 | $165 | 66 |
| 395 Liberty Ave | 0.34mi | 2/1.0 | 1,066 (-7%) | 8mo | $193,000 | $181 | 64 |
| 321 Wacona Ave | 0.28mi | 3/1.0 (+1) | 1,240 (+8%) | 8mo | $175,000 | $141 | 60 |
| 163 Park Rd | 0.47mi | 3/2.0 (+1) | 1,221 (+6%) | 2mo | $290,000 | $238 | 59 |
| 174 Coolidge Rd | 0.66mi | 2/1.5 | 1,102 (-4%) | 6mo | $221,000 | $201 | 57 |
| 207 Coolidge Rd | 0.65mi | 2/1.5 | 1,050 (-8%) | 2mo | $200,000 | $190 | 54 |
| 98 Bayton Dr | 0.53mi | 2/1.5 | 1,017 (-11%) | 5mo | $179,500 | $176 | 52 |
| 83 Keating Dr | 0.49mi | 2/2.0 | 1,020 (-11%) | 7mo | $197,812 | $194 | 51 |
| 2723 Titus Avenue Ext | 0.60mi | 2/2.0 | 1,015 (-12%) | 5mo | $205,000 | $202 | 46 |
| 54 Nixon Dr | 0.74mi | 3/1.0 (+1) | 984 (-14%) | 0mo | $127,500 | $130 | 34 |
Match score weights: distance 35% · size 25% · config 20% · recency 20%. Top-matched comps best support the ARV.
Projected returns pro-forma
-3.0% appreciation · 3.0% rent growth · sell at horizon
- IRR
- -17.1%
- Equity multiple
- 0.40×
- Total profit
- $-21,967
- Equity at exit
- $19,369
- IRR
- -8.6%
- Equity multiple
- 0.46×
- Total profit
- $-19,695
- Equity at exit
- $11,231
Cash invested: $36,372 (down + closing). Projections, not guarantees.
Landlord ↔ Tenant lean methodology
- Overall (STATE)
- 15 Strongly Tenant-Friendly
- State New York
- 15 Strongly Tenant-Friendly · D+10
- County
- — inherits STATE
- City
- — inherits STATE
ZIP-level market 14622
- Home prices YoY
- -8.1%
- Active inventory
- 48
- Price-to-rent
- 7.1×
Monthly cashflow live
- Estimated rent
- $1,524 medium interval (Pro) →
- Mortgage (P&I)
- −$681
- Tax from tax record
- −$486 /mo · $5,834/yr
- Insurance
- −$54
- HOA
- −$0
- Vacancy / Maint / Mgmt
- −$320
- Net cashflow
- $-18
Break-even live
Sensitivity live
| Price | -10% $56 | -5% $19 | +0% $-18 | +5% $-55 | +10% $-91 |
|---|---|---|---|---|---|
| Rent | -10% $-138 | -5% $-78 | +0% $-18 | +5% $42 | +10% $102 |
| Rate | -1.0pp $48 | -0.5pp $15 | base $-18 | +0.5pp $-52 | +1.0pp $-86 |
UW: 25.0% down · 7.5% · 30yr · 1.5% tax · 5.0% vac · 8.0% maint · 8.0% mgmt
Financing live
Cash to close
- Down payment
- $32,475
- Closing costs
- $3,897
- Reserves months
- —
- Total cash needed
- —
Loan-product check · same deal, 3 products live
Conventional
25% down · 7.5% · 30yr
- Down + closing
- —
- Monthly P&I
- —
- Monthly cashflow
- —
- DSCR
- —
- Eligible?
- —
Personal DTI + credit; lowest rate.
DSCR
20% down · 8.5% · 30yr
- Down + closing
- —
- Monthly P&I
- —
- Monthly cashflow
- —
- DSCR
- —
- Eligible?
- —
No personal income docs; deal must DSCR.
Hard money
10% down · 12.0% · 12mo
- Down + closing
- —
- Monthly P&I
- —
- Monthly cashflow
- —
- DSCR
- —
- Eligible?
- —
Short-term bridge; refi at stabilization.
Listing history 6 events
-
2026-06-13status $129,900 Pending 5 DOM
-
2026-06-10days on market $129,900 Active 5 DOM
-
2026-06-09days on market $129,900 Active 4 DOM
-
2026-06-09days on market $129,900 Active 3 DOM
-
2026-06-07remarks 693-char remark
-
2026-06-07$129,900 Active 2 DOM
ⓘ Source: listings_history table (triggers on properties + properties_extension) + one-shot
backfill from property_details.listing_events for pre-trigger history.
Tax reassessment forecast NY · Partial reset (capped growth)
- Current annual tax
- $5,834 · $486/mo
- Projected year-2 tax
- $5,834 · $486/mo
- Expected delta
- $0/yr ($0/mo · 0.0%)
ⓘ Screening estimate from a state-policy table — verify with the county assessor before closing.
Climate risk First Street
- Flood 1/10 Low FEMA zone X (unshaded) · 0% chance over 30 yrs
- Wildfire 1/10 Low
- Heat 2/10 Low 7 d/yr ≥96°F today · 15 d/yr by 30 yrs out
- Wind 1/10 Low
- Air quality 2/10 Low 1 unhealthy d/yr today · 2 by 30 yrs out
Nearby sold comps map
Loading sold comps map…
Walkable amenities ~0.75 mi
Loading nearby amenities…
Taxation est. · year 1
- Rental income
- $18,282
- − Mortgage interest
- −$7,276
- − Property taxes
- −$5,834
- − Insurance
- −$650
- − Repairs & maintenance
- −$1,463
- − Management
- −$1,463
- − Depreciation
- −$3,779
- Taxable loss
- −$2,181
- Est. tax savings @ 24.0%
- +$524
- After-tax cash flow
- $309/yr
For passive investors: Depreciation is non-cash, so a rental often shows a tax loss while cash-flowing — sheltering income. Rental losses are passive: they offset passive income freely, and up to $25,000/yr can offset ordinary (W-2) income if you actively participate and your MAGI is under $100k (phasing out to $0 by $150k); unused losses carry forward. On sale, claimed depreciation is recaptured at up to 25%, and gains may owe capital-gains tax (a 1031 exchange can defer both). Figures are a year-1 estimate at your 24.0% rate — not tax advice; consult a CPA.
Schools (NCES district)
- District
- East Irondequoit Central School District
- NCES district ID
- 3609690
- Math proficiency
- 40% ▼ -12.00%
- Reading proficiency
- 47% ▲ 8.00%
- Median HH income
- $48,946
- Composite
- 37.27/100
- National rank
- #4451
- State rank
- #475 of 590 in NY
Livability — Irondequoit
- Score
- 81/100
- State rank
- #92
- US rank
- #1414
Category grades
Schools grade is shown separately in the Schools card above.
Census & demographics
- Census place
- Irondequoit, NY
- County
- Monroe County · 674,131 people
- City population
- 74,252
- Metro
- Rochester, NY
- Population (ZIP)
- 12,574
- Household income
- $75,439
- Rent vs Own
- Severe rent burden
- 240.0
Population outlook (Monroe County) Hauer SSP2
- Today (2025)
- 759,460 people
- By 2030
- 757,154 · -0.3%
- By 2040
- 740,644 · -2.5%
- By 2050
- 714,443 · -5.9%
- By 2075
- 645,883 · -15.0%
- By 2100
- 547,084 · -28.0%
Race, ethnicity, and origin ACS 2023
- Neighborhood character
- Predominantly White (77%)
- Race & ethnicity
- White 77% Hispanic / Latino 10% Black 5% Two or more races 5% Asian 4%
- Hispanic origin (detail)
- Puerto Rican 8%
- Common ancestry
- Romanian 8% Lithuanian 2% Iranian 2%
- Foreign-born
- 6% · Canada, South Korea, Philippines
- Languages at home
- 89% English-only · Spanish 4% Russian/Polish/Slavic 2% Other Asian/Pacific 2%
Political lean MEDSL · Monroe
- 2024 margin
- D (+19.1) · D 59.5% · R 40.5%
- 2008→2024 swing
- +1.4pp toward D · 2008: 17.7pp · 2024: 19.1pp
- All cycles
- 2024: D+19.1 2020: D+21.0 2016: D+14.1 2012: D+17.4 2008: D+17.7
Not yet ingested
- Civics
- —
Market trends
- HPI YoY
- ▼ -23.93%
- Current HPI
- 271.5626
- Rent YoY
- —
- Metro
- Rochester, NY
- State GDP YoY
- ▲ 2.60%
- F500 in state
- 92
Industry mix (Fortune 500 HQ in NY)
| Industry | F500 HQs | Revenue |
|---|---|---|
| Financial Services | 10 | $950B |
|
||
| Consumer Goods | 9 | $162B |
|
||
| Insurance | 4 | $225B |
|
||
| Telecommunications | 2 | $144B |
|
||
| Pharmaceuticals | 2 | $112B |
|
||
| Media / Entertainment | 2 | $69B |
|
||
Price history
1 event — show timeline
- 2026-06-05 Listed $129,900 UNYREIS
Property tax history
+13.5%/yrLatest (2025): $5,834 · -48.6% YoY. Source: county tax records.
Cash-flow waterfall
monthlySold comps — $/sqft
last 12 mo · ≤1 miLoading sold comps…