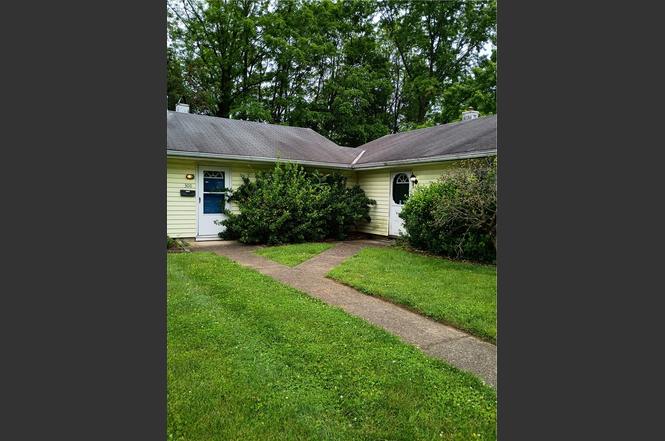
2206 Hazelton Ave
Riverside, OH 45431
$179,900C-
4 bd · 2.0 ba ·
1,500 sqft ·
Built 1954
· MultiFamily
· Active
· 2 DOM
Cashflow @ list (25.0% down · 7.5%)
Estimated rent
$2,205/mo
Mortgage (P&I)
−$943
Tax + insurance
−$468
HOA
−$0
Vac / Maint / Mgmt
−$463
Net cashflow
$330/mo
Annual
$3,962/yr
Cap rate
8.50%
Cash-on-cash
7.87%
DSCR
1.35
1% rule
1.23%
Cash to close
$50,372
Investor read
- This is a 2 × 2-bed/1.0-bath units multifamily listed at $180k.
- At list price, monthly cash flow is $330 ($4k/yr) — positive. Per door: $165/mo.
- The deal already cash-flows at list — no discount required.
- Meets the 1% rule at list price ($2k rent vs $180k).
- Only 2 days on market — expect competitive offers; lowballing is unlikely to land.
- Local home prices are declining (-3.0%/yr); year-one equity from $1k of loan paydown is wiped out by about $5k of value loss. Plan a longer hold.
- Location reads 64/100 on livability (#775 in OH) — a middle-class / working-renter tenant base. Strengths: cost of living A+, housing A+; Watch: crime D+, employment D+, schools D.
- Mad River Local (suburban): math 34% / reading 50% proficiency, ranked #531 of 656 in OH (top 81%) — families likely to look elsewhere, expect single-tenant / working-renter base with shorter leases.
- Watch-outs: property tax is 2.6% of price; built in 1954 — expect roof / HVAC / electrical / plumbing capex.
- Market conditions: Rents rising fast (+5.8%/yr); 124 active listings in the ZIP; 11 comparable units currently listed for rent nearby; rentals leasing fast (median 4d on market — plan ~1-2 weeks tenant-placement turnaround); solid renter incomes; 907 units permitted in Montgomery County in 2024 (416 in 5+ unit buildings).
- Montgomery County population projected at -10% by 2050 — secular population decline; favor cash flow + early exit over multi-decade hold.
- Current owner paid $82k; list at $180k implies a 121% gain — meaningful room to come down on a strong offer.
- At projected returns (-3.0% appreciation + 5.8% rent growth), your $50k cash investment doubles in ~9 years — after that, you're playing with house money.
- Cap rate 8.5% vs local median 4.9% in Riverside — top-decile yield for the area; either an underpriced asset or a hidden risk that comps aren't pricing in. Stress-test before assuming the spread holds.
- This rent runs 32% of the median local income ($83k/yr) — at the standard rent-burdened threshold; future hikes will face affordability resistance.
Questions for listing agent
- Can we see the unit-by-unit rent roll, current vacancy, and any below-market leases? What's the average tenancy length?
- What capital expenditures (roof, boiler, parking lot, exteriors) have been made in the last 5 years, and what's planned in the next 2?
- Built in 1954 — when were the roof, HVAC, electrical panel, plumbing, and water heater last replaced?
- Property tax is high relative to price — has the assessment been appealed recently, and will the sale trigger a re-assessment?
- Is there a deadline driving the sale (1031 exchange, divorce, estate, relocation)? That informs how much negotiation room exists.
- Schools are D-rated, which usually means shorter tenancies and higher turnover. Who's the typical renter profile here, and what's been the actual vacancy rate?
- Crime grade is D in this area — have there been break-ins, vandalism, or insurance claims at this property in the last 3 years? What carrier currently insures it and at what premium?
- What's the average days-on-market for RENTAL listings here right now (not sales)? A rising rental-DOM trend means longer vacancies and softer asking-rent achievability than the comps imply.
CashFlowRE · CFR-P2TGJBEZAFKTYT
· Data 2 days ago
cashflowre.app · 2026-05-29