 Duplex
2206 Hazelton Ave · Riverside, OH
Flood risk 1/10 · Minimal
- FEMA flood zone
- X (unshaded)
- Chance of flooding over 30 yrs
- 0.0%
- Est. flood insurance / yr
- $507 – $1,088
Fire risk 1/10 · Minimal
- Est. fire insurance / yr
- $713 – $1,323
Heat risk 3/10 · Minor
- Hot days now (above 101°F)
- 7 days/yr
- Hot days in 30 yrs
- 18 days/yr
Wind risk 2/10 · Minimal
- Chance of severe wind over 30 yrs
- 0.0%
Air-quality risk 4/10 · Minor
- Unhealthy air days now
- 4 days/yr
- Unhealthy air days in 30 yrs
- 5 days/yr
Risk factors via First Street. Map © Google.
Why this score? — see what drove the C- grade
The composite is a weighted blend of 9 inputs, each scored 0–100. Each bar is that input's sub-score; the figure is the points it added to the 100-point composite (weight × sub-score).
- Cash flow +23.3/30.0
- DSCR +7.5/10.0
- 1% rule +7.3/10.0
- Rent growth +3.9/5.0
- Schools +3.5/10.0
- Livability +3.2/5.0
- Condition / age +2.5/5.0
- ARV discount +0.0/15.0
- Appreciation +0.0/10.0
$179,900
🖨 Deal sheet 📄 Offer letter ✓ Due diligence
Multi-family units
County records classify this as Multi-Family (2-4 Unit). Listing-text estimate: 2 units. confirmed
Listing remarks
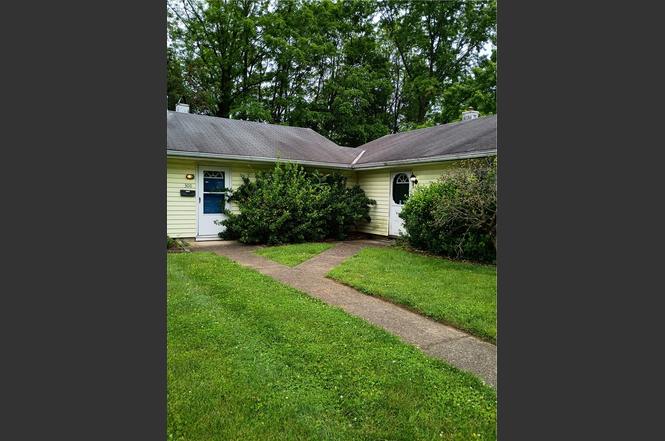
Discover an exceptional opportunity in Dayton with this versatile multi-family property, perfectly designed for both comfortable living and savvy investment. This charming duplex offers two distinct units, providing a flexible arrangement for owners seeking supplemental income or investors looking to expand their portfolio. Each unit provides a welcoming atmosphere, promising a sense of home for its residents. The property is thoughtfully appointed with essential appliances, including a range, ensuring immediate functionality. Outdoor living is enhanced by a covered patio, perfect for relaxation or entertaining, complemented by the practical addition of a storage shed for convenience. Storm
Key facts
- Two distinct units
- Cable tv readiness
- Covered patio
Tags
Property features AI
Finance
- Financial info: Offered for sale; Multi-unit property with 2 units and 1 building
Exterior
- Parking: No garage
- Utilities: Has cooling; Has heating; Natural gas
- Home design: Single-story building; Brick and frame construction
- Construction: Brick and frame construction
- Exterior features: Residential zoning; Lot approximately 55 x 125 (0.16 acres)
Interior
- Kitchen: Range; Refrigerator
- Bedrooms: Four bedrooms per unit (multi-unit property)
- Bathrooms: Two full bathrooms (total listed)
- Heating & cooling: Central air; Window unit(s); Forced air heating; Natural gas heating
- Interior features: Crawl space basement
- Laundry & utility: No specific laundry details provided
Neighborhood map
What this means for you Summary
Snapshot
- This is a 2 × 2-bed/1.0-bath units multifamily listed at $180k.
Deal economics
- At list price, monthly cash flow is $330 ($4k/yr) — positive. Per door: $165/mo.
- The deal already cash-flows at list — no discount required.
- Meets the 1% rule at list price ($2k rent vs $180k).
- Cap rate 8.5% vs local median 4.9% in Riverside — top-decile yield for the area; either an underpriced asset or a hidden risk that comps aren't pricing in. Stress-test before assuming the spread holds.
Location & tenants
- Location reads 64/100 on livability (#775 in OH) — a middle-class / working-renter tenant base. Strengths: cost of living A+, housing A+; Watch: crime D+, employment D+, schools D.
- Mad River Local (suburban): math 34% / reading 50% proficiency, ranked #531 of 656 in OH (top 81%) — families likely to look elsewhere, expect single-tenant / working-renter base with shorter leases.
- Market conditions: Rents rising fast (+5.8%/yr); 124 active listings in the ZIP; 11 comparable units currently listed for rent nearby; rentals leasing fast (median 3d on market — plan ~1-2 weeks tenant-placement turnaround); solid renter incomes; 907 units permitted in Montgomery County in 2024 (416 in 5+ unit buildings).
- This rent runs 32% of the median local income ($83k/yr) — at the standard rent-burdened threshold; future hikes will face affordability resistance.
Forward outlook
- Local home prices are declining (-3.0%/yr); year-one equity from $1k of loan paydown is wiped out by about $5k of value loss. Plan a longer hold.
- Montgomery County population projected at -10% by 2050 — secular population decline; favor cash flow + early exit over multi-decade hold.
- At projected returns (-3.0% appreciation + 5.8% rent growth), your $50k cash investment doubles in ~9 years — after that, you're playing with house money.
Negotiation context
- Only 2 days on market — expect competitive offers; lowballing is unlikely to land.
- Current owner paid $82k; list at $180k implies a 121% gain — meaningful room to come down on a strong offer.
Risks & watch-outs
- Watch-outs: property tax is 2.6% of price; built in 1954 — expect roof / HVAC / electrical / plumbing capex.
Questions for the listing agent
- Can we see the unit-by-unit rent roll, current vacancy, and any below-market leases? What's the average tenancy length?
- What capital expenditures (roof, boiler, parking lot, exteriors) have been made in the last 5 years, and what's planned in the next 2?
- Built in 1954 — when were the roof, HVAC, electrical panel, plumbing, and water heater last replaced?
- Property tax is high relative to price — has the assessment been appealed recently, and will the sale trigger a re-assessment?
- Is there a deadline driving the sale (1031 exchange, divorce, estate, relocation)? That informs how much negotiation room exists.
- Schools are D-rated, which usually means shorter tenancies and higher turnover. Who's the typical renter profile here, and what's been the actual vacancy rate?
- Crime grade is D in this area — have there been break-ins, vandalism, or insurance claims at this property in the last 3 years? What carrier currently insures it and at what premium?
- What's the average days-on-market for RENTAL listings here right now (not sales)? A rising rental-DOM trend means longer vacancies and softer asking-rent achievability than the comps imply.
- What's the recent tenant-quality profile in this submarket — average credit score on applications, eviction rate, late-payment / NSF rate, and stable-employment percentage? A property-management company in the area should have these aggregated.
- How much new apartment / multifamily construction is in the pipeline within 1–3 miles? Heavy new supply (>2% of stock underway) typically softens rents 12–24 months out; light construction supports rent growth.
Investment metrics
- 1% rule
- 1.23% ✓
- Cap rate
- 8.50%
- Cash-on-cash
- 7.87%
- DSCR
- 1.35
- GRM
- 6.8
CMA / ARV
- ARV (on-the-fly)
- $150,000
- Comps found
- 1
Show comp detail 1 sale within ~0.75 mi
| Address | Dist | Beds/Ba | Sqft | Sold | Price | $/sf | Match |
|---|---|---|---|---|---|---|---|
| 1626 Darst Ave | 0.67mi | 3/3.0 (-1) | 1,656 (+10%) | 7mo | $165,000 | $100 | 37 |
Match score weights: distance 35% · size 25% · config 20% · recency 20%. Top-matched comps best support the ARV.
Projected returns pro-forma
-3.0% appreciation · 5.79% rent growth · sell at horizon
- IRR
- -0.8%
- Equity multiple
- 0.97×
- Total profit
- $-1,624
- Equity at exit
- $26,824
- IRR
- 11.9%
- Equity multiple
- 2.07×
- Total profit
- $53,867
- Equity at exit
- $15,554
Cash invested: $50,372 (down + closing). Projections, not guarantees.
Landlord ↔ Tenant lean methodology
- Overall (STATE)
- 73 Landlord-Friendly
- State Ohio
- 73 Landlord-Friendly · R+6
- County
- — inherits STATE
- City
- — inherits STATE
ZIP-level market 45431
- Home prices YoY
- -35.0%
- Rents YoY
- 5.8%
- Active inventory
- 124
- Price-to-rent
- 13.6×
Monthly cashflow live
- Estimated rent
- $2,205 high interval (Pro) →
- Mortgage (P&I)
- −$943
- Tax from tax record
- −$393 /mo · $4,721/yr
- Insurance
- −$75
- HOA
- −$0
- Vacancy / Maint / Mgmt
- −$463
- Net cashflow
- $330
Break-even live
2-unit breakdown (identical units grouped — click to expand)
| Units | Beds | Baths | Est. rent |
|---|---|---|---|
| 2× units | 2 | 1 | $2,206 |
| #1 | 2 | 1 | $1,103 |
| #2 | 2 | 1 | $1,103 |
| Total (2 units) | $2,205 | ||
UW: 25.0% down · 7.5% · 30yr · 1.5% tax · 5.0% vac · 8.0% maint · 8.0% mgmt
Financing live
Cash to close
- Down payment
- $44,975
- Closing costs
- $5,397
- Reserves months
- —
- Total cash needed
- —
Loan-product check · same deal, 3 products live
Conventional
25% down · 7.5% · 30yr
- Down + closing
- —
- Monthly P&I
- —
- Monthly cashflow
- —
- DSCR
- —
- Eligible?
- —
Personal DTI + credit; lowest rate.
DSCR
20% down · 8.5% · 30yr
- Down + closing
- —
- Monthly P&I
- —
- Monthly cashflow
- —
- DSCR
- —
- Eligible?
- —
No personal income docs; deal must DSCR.
Hard money
10% down · 12.0% · 12mo
- Down + closing
- —
- Monthly P&I
- —
- Monthly cashflow
- —
- DSCR
- —
- Eligible?
- —
Short-term bridge; refi at stabilization.
Rent comps 11 comps
| Address | Beds | Baths | Sqft | Rent | $/sqft | DOM | Units | Dist |
|---|---|---|---|---|---|---|---|---|
| 531 S Hayden Ave Dayton, OH | 3.0 | 1.0 | 1200 | $1,325 | $1.10 | 11d | 1 | 0.12mi |
| 4924 Bayside Dr Dayton, OH | 3.0 | 2.0 | 1236 | $1,545 | $1.25 | 43d | 1 | 0.37mi |
| 4403 Burkhardt Ave Dayton, OH | 3.0 | 1.0–2.0 | 800 | $1,100 | $1.38 | 2d | 1 | 0.57mi |
| 819 Gleneagle Dr Dayton, OH | 3.0 | 1.5 | 1538 | $1,550 | $1.01 | 11d | 1 | 0.98mi |
| 3719 E 3rd St Unit 3717 Dayton, OH | 3.0 | 1.0 | 1092 | $1,100 | $1.01 | 2d | 1 | 1.03mi |
| 3707 E 3rd St Unit 3705 Dayton, OH | 3.0 | 1.0 | 1410 | $1,045 | $0.74 | 23d | 1 | 1.05mi |
| 1520 S Smithville Rd Dayton, OH | 3.0 | 2.0 | 1481 | $1,345 | $0.91 | 2d | 1 | 1.23mi |
| 1659 Hearthstone Dr Dayton, OH | 3.0 | 1.0 | 1102 | $1,195 | $1.08 | 2d | 1 | 1.23mi |
| 115 Livingston Ave Dayton, OH | 3.0 | 1.0 | 1624 | $1,450 | $0.89 | 44d | 1 | 1.26mi |
| 314 Sheridan Ave Dayton, OH | 3.0 | 1.0 | 1258 | $1,150 | $0.91 | 3d | 1 | 1.32mi |
| 706 Kolping Ave Unit 706 Dayton, OH | 3.0 | 1.5 | 1172 | $1,300 | $1.11 | 2d | 1 | 1.37mi |
Listing history 3 events
-
2026-06-18days on market $179,900 Active 2 DOM
-
2026-06-16remarks 699-char remark
-
2026-06-16$179,900 Active 1 DOM
ⓘ Source: listings_history table (triggers on properties + properties_extension) + one-shot
backfill from property_details.listing_events for pre-trigger history.
Tax reassessment forecast OH · Partial reset (capped growth)
- Current annual tax
- $4,721 · $393/mo
- Projected year-2 tax
- $4,721 · $393/mo
- Expected delta
- $0/yr ($0/mo · 0.0%)
ⓘ Screening estimate from a state-policy table — verify with the county assessor before closing.
Climate risk First Street
- Flood 1/10 Low FEMA zone X (unshaded) · 0% chance over 30 yrs
- Wildfire 1/10 Low
- Heat 3/10 Moderate 7 d/yr ≥101°F today · 18 d/yr by 30 yrs out
- Wind 2/10 Low 0% chance of damaging wind over 30 yrs
- Air quality 4/10 Moderate 4 unhealthy d/yr today · 5 by 30 yrs out
Nearby sold comps map
Loading sold comps map…
Walkable amenities ~0.75 mi
Loading nearby amenities…
Taxation est. · year 1
- Rental income
- $26,460
- − Mortgage interest
- −$10,077
- − Property taxes
- −$4,721
- − Insurance
- −$900
- − Repairs & maintenance
- −$2,117
- − Management
- −$2,117
- − Depreciation
- −$5,233
- Taxable income
- $1,295
- Est. tax owed @ 24.0%
- −$311
- After-tax cash flow
- $3,651/yr
For passive investors: Depreciation is non-cash, so a rental often shows a tax loss while cash-flowing — sheltering income. Rental losses are passive: they offset passive income freely, and up to $25,000/yr can offset ordinary (W-2) income if you actively participate and your MAGI is under $100k (phasing out to $0 by $150k); unused losses carry forward. On sale, claimed depreciation is recaptured at up to 25%, and gains may owe capital-gains tax (a 1031 exchange can defer both). Figures are a year-1 estimate at your 24.0% rate — not tax advice; consult a CPA.
Schools (NCES district)
- District
- Mad River Local
- NCES district ID
- 3904870
- Math proficiency
- 34% ▼ -23.00%
- Reading proficiency
- 50% ▼ -8.00%
- Median HH income
- $41,560
- Composite
- 35.28/100
- National rank
- #4972
- State rank
- #531 of 656 in OH
Livability — Riverside
- Score
- 64/100
- State rank
- #775
- US rank
- #14045
Category grades
Schools grade is shown separately in the Schools card above.
Census & demographics
- Census place
- Riverside, OH
- County
- Greene County · 132,120 people
- Metro
- Dayton-Kettering, OH
- Population (ZIP)
- 27,951
- Household income
- $83,175
- Rent vs Own
- Severe rent burden
- 622.0
Population outlook (Montgomery County) Hauer SSP2
- Today (2025)
- 523,241 people
- By 2030
- 514,948 · -1.6%
- By 2040
- 493,378 · -5.7%
- By 2050
- 469,639 · -10.2%
- By 2075
- 418,360 · -20.0%
- By 2100
- 353,315 · -32.5%
Race, ethnicity, and origin ACS 2023
- Neighborhood character
- Predominantly White (78%)
- Race & ethnicity
- White 78% Two or more races 8% Hispanic / Latino 6% Asian 5% Black 4%
- Hispanic origin (detail)
- Mexican 1% Puerto Rican 2%
- Common ancestry
- Italian 3% Slovak 2% Lithuanian 2%
- Foreign-born
- 6% · South Korea, Canada, Jamaica
- Languages at home
- 92% English-only · Spanish 3% Other Indo-European 2% Korean 1%
Political lean MEDSL · Montgomery
- 2024 margin
- Toss-up / Even · D 49.8% · R 49.3%
- 2008→2024 swing
- -5.8pp toward R · 2008: 6.2pp · 2024: 0.5pp
- All cycles
- 2024: D+0.5 2020: D+2.2 2016: R+1.2 2012: D+3.1 2008: D+6.2
Not yet ingested
- Civics
- —
Market trends
- HPI YoY
- ▼ -148.58%
- Current HPI
- 276.444
- Rent YoY
- ▲ 5.79%
- Metro
- Dayton-Kettering, OH
- State GDP YoY
- ▲ 1.98%
- F500 in state
- 48
Industry mix (Fortune 500 HQ in OH)
| Industry | F500 HQs | Revenue |
|---|---|---|
| Insurance | 3 | $145B |
|
||
| Industrial Machinery | 3 | $49B |
|
||
| Financial Services | 3 | $24B |
|
||
| Consumer Goods | 2 | $93B |
|
||
| Aerospace / Defense | 2 | $47B |
|
||
| Utilities | 2 | $33B |
|
||
Price history
+139.9% since first listed4 events — show timeline
- 2026-06-16 Listed $179,900 Dayton MLS
- 2020-02-13 Sold (Public Records) $95,000 Public Records
- 2020-02-13 Sold (Public Records) $81,500 Public Records
- 2003-02-26 Sold (Public Records) $75,000 Public Records
Property tax history
+8.9%/yrLatest (2025): $4,721 · +2.2% YoY. Source: county tax records.
Cash-flow waterfall
monthlySold comps — $/sqft
last 12 mo · ≤1 miLoading sold comps…