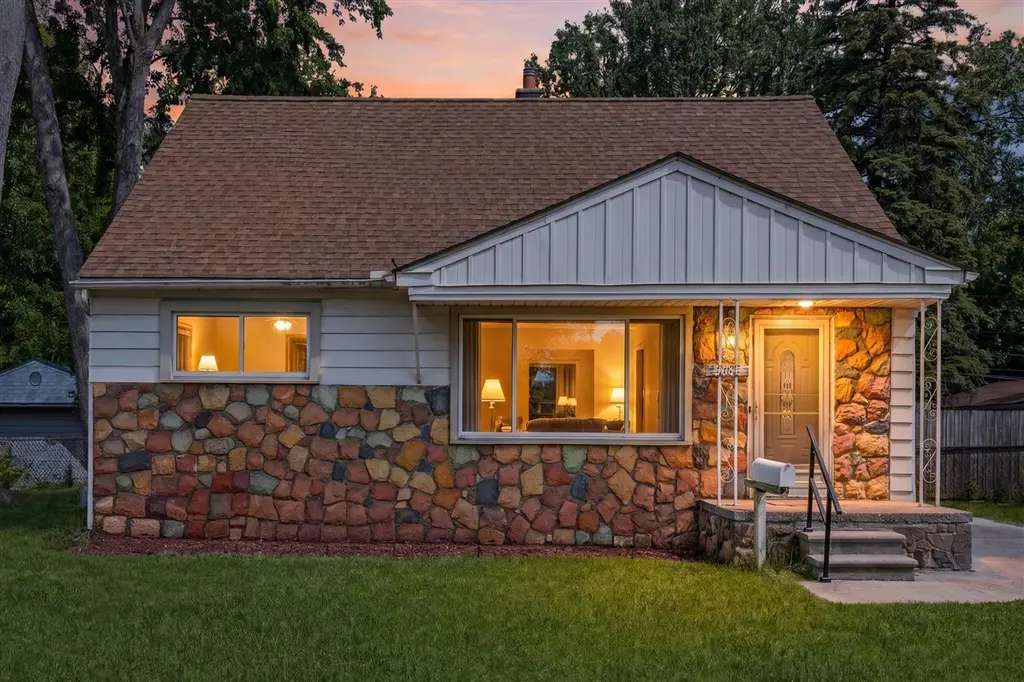
28836 Marquette St
Garden City, MI 48135
$229,000D-
4 bd · 1.0 ba ·
1,463 sqft ·
Built 1954
· SingleFamily
· Pending
· 3 DOM
Cashflow @ list (25.0% down · 7.5%)
Estimated rent
$1,938/mo
Mortgage (P&I)
−$1,201
Tax + insurance
−$350
HOA
−$0
Vac / Maint / Mgmt
−$407
Net cashflow
$-20/mo
Annual
$-243/yr
Cap rate
6.19%
Cash-on-cash
-0.38%
DSCR
0.98
1% rule
0.85%
Cash to close
$64,120
Investor read
- This is a 4-bed/1.0-bath single-family listed at $229k.
- At list price, monthly cash flow is $-20 ($-243/yr) — negative.
- To cash-flow at today's rent, offer at most $225k (1.6% below list).
- To meet the 1% rule (rent ≥ 1% of price), the offer needs to be $194k (15.4% below list).
- Only 3 days on market — expect competitive offers; lowballing is unlikely to land.
- Recommended offer: $194k (15.4% below list) — sets the bar for 1% rule.
- Local home prices are declining (-3.0%/yr); year-one equity from $2k of loan paydown is wiped out by about $7k of value loss. Plan a longer hold.
- Location reads 82/100 on livability (#53 in MI, #1,047 nationally) — a professional / high-income tenant draw. Strengths: cost of living A+, housing A+, commute A; Watch: employment C-, schools D-.
- Garden City Public Schools (suburban): math 22% / reading 36% proficiency, ranked #365 of 540 in MI (top 68%) — low school quality limits family demand, transient renter base, plan for 1-2y turnover.
- Watch-outs: built in 1954 — expect roof / HVAC / electrical / plumbing capex.
- Market conditions: Rents rising (+3.6%/yr); 134 active listings in the ZIP; 15 comparable units currently listed for rent nearby; rentals at typical pace (median 17d on market — plan ~3-4 weeks tenant-placement turnaround); 2,639 units permitted in Wayne County in 2024 (1,216 in 5+ unit buildings).
- Wayne County population projected at -17% by 2050 — secular population decline; favor cash flow + early exit over multi-decade hold.
- 9 sale attempts since 23y ago; this cycle's ask is 91% above the opening price — seller raised mid-cycle; expect resistance to lowballs.
- Current owner paid $137k; list at $229k implies a 67% gain — meaningful room to come down on a strong offer.
- This rent runs 35% of the median local income ($67k/yr) — at the standard rent-burdened threshold; future hikes will face affordability resistance.
Questions for listing agent
- What do current leases actually rent for vs. the listed asking? Can we see a recent rent roll and the last 12 months of T-12 income?
- Built in 1954 — when were the roof, HVAC, electrical panel, plumbing, and water heater last replaced?
- Is there a deadline driving the sale (1031 exchange, divorce, estate, relocation)? That informs how much negotiation room exists.
- Schools are D-rated, which usually means shorter tenancies and higher turnover. Who's the typical renter profile here, and what's been the actual vacancy rate?
- The area grade is low — what's the realistic commute time and amenity access for the typical tenant pool here? Any planned neighborhood developments (good or bad) we should know about?
- What's the average days-on-market for RENTAL listings here right now (not sales)? A rising rental-DOM trend means longer vacancies and softer asking-rent achievability than the comps imply.
- What's the recent tenant-quality profile in this submarket — average credit score on applications, eviction rate, late-payment / NSF rate, and stable-employment percentage? A property-management company in the area should have these aggregated.
- How much new for-sale + rental construction is in the pipeline within 1–3 miles? Heavy new supply typically softens prices + rents 12–24 months out; constrained supply supports both.
CashFlowRE · CFR-P3G0Q31902ZKCS
· Data 1 week ago
cashflowre.app · 2026-05-29