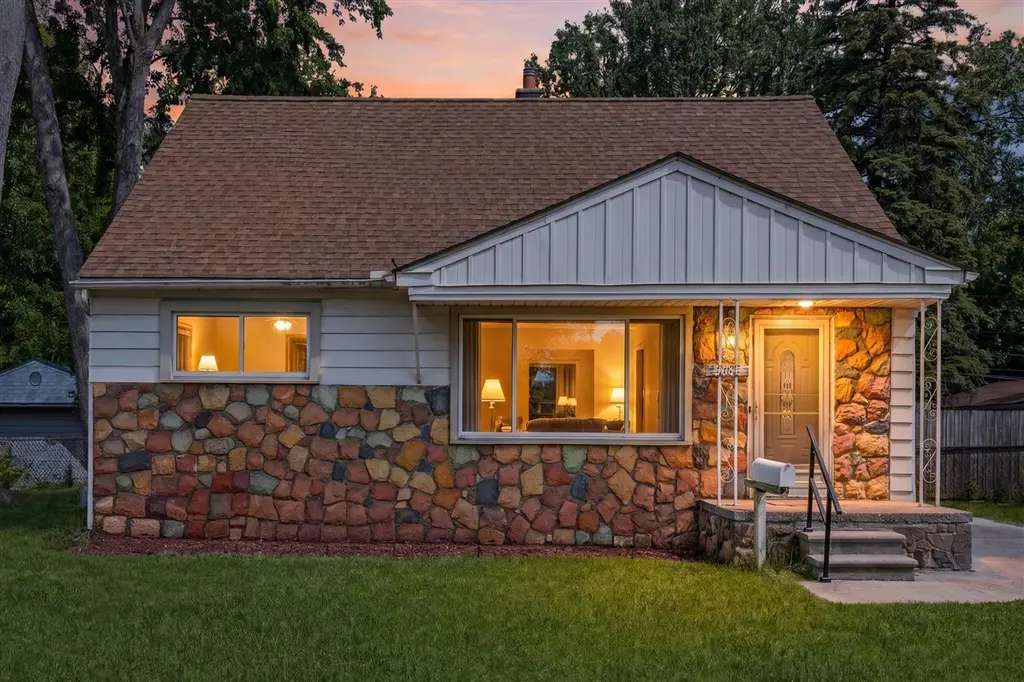
28836 Marquette St · Garden City, MI
Flood risk 1/10 · Minimal
- FEMA flood zone
- X (unshaded)
- Chance of flooding over 30 yrs
- 0.0%
- Est. flood insurance / yr
- $507 – $1,088
Fire risk 1/10 · Minimal
- Est. fire insurance / yr
- $784 – $1,456
Heat risk 3/10 · Minor
- Hot days now (above 98°F)
- 7 days/yr
- Hot days in 30 yrs
- 15 days/yr
Wind risk 2/10 · Minimal
- Chance of severe wind over 30 yrs
- —
Air-quality risk 2/10 · Minimal
- Unhealthy air days now
- 1 days/yr
- Unhealthy air days in 30 yrs
- 2 days/yr
Risk factors via First Street. Map © Google.
Why this score? — see what drove the D- grade
The composite is a weighted blend of 9 inputs, each scored 0–100. Each bar is that input's sub-score; the figure is the points it added to the 100-point composite (weight × sub-score).
- Cash flow +12.8/30.0
- Livability +4.1/5.0
- DSCR +3.8/10.0
- ARV discount +3.6/15.0
- 1% rule +3.5/10.0
- Rent growth +3.4/5.0
- Schools +2.6/10.0
- Condition / age +2.5/5.0
- Appreciation +0.0/10.0
$229,000
🖨 Deal sheet 📄 Offer letter ✓ Due diligence
Listing remarks MLS
At the heart of this home is a centrally laid-out kitchen featuring abundant cabinet space that flows effortlessly into all of the main living areas. Imagine mornings or evenings making meals where you can truly feel connected and with loved ones or friends. A massive rear addition adds a sprawling family room, perfect for movie nights, games, or listening to your favorite albums. Relax at night in your spacious, rare, first floor master bedroom complete with its own private en-suite bath, separated from other rooms for your privacy. Storage is a major highlight, with deep closets and organizational space throughout, along with space for gatherings in the finished basement. Outside, the 1.5-car garage with a long driveway, offers plenty of parking for cars and rec. vehicles. The large backyard is made for summer gatherings or letting pets run free, backing up directly to a beautiful backdrop of mature woods. With wonderful neighbors and a prime location, you'll love to call this home.
Key facts
- 8,276 sq ft lot
- Garage
- Built 1954
Property features AI
Exterior
- Parking: Detached garage; 1.5 garage spaces (garage present, not attached)
- Utilities: Public water; Natural gas water heater
- Home design: Single family residence; Residential property; Living area around 2,003; Built in 1954
- Construction: Aluminum siding, stone, and vinyl siding exterior; Asphalt shingle roof; Foundation includes crawl space and partial/full basement
- Exterior features: Sidewalk; Paved road access
Interior
- Kitchen: Range; Microwave; Refrigerator; Disposal; Eat-in kitchen layout
- Bedrooms: Primary bedroom (approx. 13.1 x 11.11); Bedroom 2 (approx. 11.5 x 8.11); Bedroom 3 (approx. 10.11 x 12.1); Bedroom 4 — upstairs (approx. 31.6 x 11)
- Bathrooms: 2 full bathrooms; Primary bathroom (approx. 4.11 x 8.1); Bathroom 1 (approx. 8.8 x 6.11)
- Heating & cooling: Forced air heating; Wall-mounted cooling units
- Interior features: Garage door opener; Eat-in kitchen; 11 total rooms
- Laundry & utility: Washer; Dryer; Natural gas water heater
Neighborhood map
What this means for you Summary
Snapshot
- This is a 4-bed/1.0-bath single-family listed at $229k.
Deal economics
- At list price, monthly cash flow is $-20 ($-243/yr) — negative.
- To cash-flow at today's rent, offer at most $225k (1.6% below list).
- To meet the 1% rule (rent ≥ 1% of price), the offer needs to be $194k (15.4% below list).
- Recommended offer: $194k (15.4% below list) — sets the bar for 1% rule.
Location & tenants
- Location reads 82/100 on livability (#53 in MI, #1,047 nationally) — a professional / high-income tenant draw. Strengths: cost of living A+, housing A+, commute A; Watch: employment C-, schools D-.
- Garden City Public Schools (suburban): math 22% / reading 36% proficiency, ranked #365 of 540 in MI (top 68%) — low school quality limits family demand, transient renter base, plan for 1-2y turnover.
- Market conditions: Rents rising (+3.6%/yr); 134 active listings in the ZIP; 15 comparable units currently listed for rent nearby; rentals at typical pace (median 17d on market — plan ~3-4 weeks tenant-placement turnaround); 2,639 units permitted in Wayne County in 2024 (1,216 in 5+ unit buildings).
- This rent runs 35% of the median local income ($67k/yr) — at the standard rent-burdened threshold; future hikes will face affordability resistance.
Forward outlook
- Local home prices are declining (-3.0%/yr); year-one equity from $2k of loan paydown is wiped out by about $7k of value loss. Plan a longer hold.
- Wayne County population projected at -17% by 2050 — secular population decline; favor cash flow + early exit over multi-decade hold.
Negotiation context
- Only 3 days on market — expect competitive offers; lowballing is unlikely to land.
- 9 sale attempts since 23y ago; this cycle's ask is 91% above the opening price — seller raised mid-cycle; expect resistance to lowballs.
- Current owner paid $137k; list at $229k implies a 67% gain — meaningful room to come down on a strong offer.
Risks & watch-outs
- Watch-outs: built in 1954 — expect roof / HVAC / electrical / plumbing capex.
Questions for the listing agent
- What do current leases actually rent for vs. the listed asking? Can we see a recent rent roll and the last 12 months of T-12 income?
- Built in 1954 — when were the roof, HVAC, electrical panel, plumbing, and water heater last replaced?
- Is there a deadline driving the sale (1031 exchange, divorce, estate, relocation)? That informs how much negotiation room exists.
- Schools are D-rated, which usually means shorter tenancies and higher turnover. Who's the typical renter profile here, and what's been the actual vacancy rate?
- The area grade is low — what's the realistic commute time and amenity access for the typical tenant pool here? Any planned neighborhood developments (good or bad) we should know about?
- What's the average days-on-market for RENTAL listings here right now (not sales)? A rising rental-DOM trend means longer vacancies and softer asking-rent achievability than the comps imply.
- What's the recent tenant-quality profile in this submarket — average credit score on applications, eviction rate, late-payment / NSF rate, and stable-employment percentage? A property-management company in the area should have these aggregated.
- How much new for-sale + rental construction is in the pipeline within 1–3 miles? Heavy new supply typically softens prices + rents 12–24 months out; constrained supply supports both.
Investment metrics
- 1% rule
- 0.85% ✗
- Cap rate
- 6.19%
- Cash-on-cash
- -0.38%
- DSCR
- 0.98
- GRM
- 9.8
CMA / ARV
- ARV (on-the-fly)
- $210,672
- Comps found
- 12
Show comp detail 12 sales within ~0.75 mi
| Address | Dist | Beds/Ba | Sqft | Sold | Price | $/sf | Match |
|---|---|---|---|---|---|---|---|
| 28965 Marquette St | 0.10mi | 3/1.0 (-1) | 1,593 (+9%) | 1mo | $230,000 | $144 | 74 |
| 28315 Sheridan St | 0.30mi | 3/2.0 (-1) | 1,461 (-0%) | 8mo | $168,500 | $115 | 70 |
| 29615 Rosslyn Ave | 0.48mi | 3/1.0 (-1) | 1,475 (+1%) | 6mo | $216,000 | $146 | 66 |
| 28612 Donnelly St | 0.32mi | 3/1.5 (-1) | 1,363 (-7%) | 2mo | $269,000 | $197 | 66 |
| 28951 Cherry Hill Rd | 0.54mi | 3/1.0 (-1) | 1,392 (-5%) | 1mo | $152,000 | $109 | 61 |
| 29031 Rosslyn Ave | 0.27mi | 3/2.0 (-1) | 1,296 (-11%) | 6mo | $240,000 | $185 | 54 |
| 1722 Deering St | 0.54mi | 4/2.0 | 1,320 (-10%) | 0mo | $165,000 | $125 | 54 |
| 29932 John Hauk St | 0.68mi | 3/2.0 (-1) | 1,543 (+6%) | 0mo | $259,500 | $168 | 50 |
| 28992 Kathryn St | 0.45mi | 3/1.5 (-1) | 1,254 (-14%) | 2mo | $245,000 | $195 | 47 |
| 28462 Birchlawn St | 0.69mi | 4/2.0 | 1,560 (+7%) | 7mo | $185,000 | $119 | 47 |
| 5739 Harrison St | 0.61mi | 3/1.0 (-1) | 1,633 (+12%) | 2mo | $220,000 | $135 | 45 |
| 28664 Fernwood St | 0.63mi | 4/2.0 | 1,666 (+14%) | 4mo | $175,000 | $105 | 40 |
Match score weights: distance 35% · size 25% · config 20% · recency 20%. Top-matched comps best support the ARV.
Projected returns pro-forma
-3.0% appreciation · 3.65% rent growth · sell at horizon
- IRR
- -16.2%
- Equity multiple
- 0.42×
- Total profit
- $-37,112
- Equity at exit
- $34,145
- IRR
- -6.8%
- Equity multiple
- 0.55×
- Total profit
- $-28,633
- Equity at exit
- $19,800
Cash invested: $64,120 (down + closing). Projections, not guarantees.
Landlord ↔ Tenant lean methodology
- Overall (STATE)
- 62 Landlord-Friendly
- State Michigan
- 62 Landlord-Friendly · EVEN
- County
- — inherits STATE
- City
- — inherits STATE
ZIP-level market 48135
- Rents YoY
- 3.6%
- Active inventory
- 134
- Price-to-rent
- 9.8×
Monthly cashflow live
- Estimated rent
- $1,938 high interval (Pro) →
- Mortgage (P&I)
- −$1,201
- Tax from tax record
- −$255 /mo · $3,059/yr
- Insurance
- −$95
- HOA
- −$0
- Vacancy / Maint / Mgmt
- −$407
- Net cashflow
- $-20
Break-even live
UW: 25.0% down · 7.5% · 30yr · 1.5% tax · 5.0% vac · 8.0% maint · 8.0% mgmt
Financing live
Cash to close
- Down payment
- $57,250
- Closing costs
- $6,870
- Reserves months
- —
- Total cash needed
- —
Loan-product check · same deal, 3 products live
Conventional
25% down · 7.5% · 30yr
- Down + closing
- —
- Monthly P&I
- —
- Monthly cashflow
- —
- DSCR
- —
- Eligible?
- —
Personal DTI + credit; lowest rate.
DSCR
20% down · 8.5% · 30yr
- Down + closing
- —
- Monthly P&I
- —
- Monthly cashflow
- —
- DSCR
- —
- Eligible?
- —
No personal income docs; deal must DSCR.
Hard money
10% down · 12.0% · 12mo
- Down + closing
- —
- Monthly P&I
- —
- Monthly cashflow
- —
- DSCR
- —
- Eligible?
- —
Short-term bridge; refi at stabilization.
Rent comps 15 comps
| Address | Beds | Baths | Sqft | Rent | $/sqft | DOM | Units | Dist |
|---|---|---|---|---|---|---|---|---|
| 641 Gilman St Garden City, MI | 3.0 | 1.0 | 1300 | $2,600 | $2.00 | 16d | 1 | 0.38mi |
| 536 N Leona Ave Garden City, MI | 3.0 | 1.0 | 1000 | $1,440 | $1.44 | 12d | 1 | 0.63mi |
| 5927 Lathers St Garden City, MI | 3.0 | 1.0 | 1000 | $1,600 | $1.60 | 1d | 1 | 0.73mi |
| 5839 Helen St Garden City, MI | 3.0 | 1.0 | 984 | $1,500 | $1.52 | 24d | 1 | 0.74mi |
| 29061 Balmoral St Garden City, MI | 3.0 | 1.0 | 1850 | $2,250 | $1.22 | 16d | 1 | 0.90mi |
| 6365 Helen St Garden City, MI | 3.0 | 1.0 | 1195 | $1,650 | $1.38 | 10d | 1 | 0.98mi |
| 29203 Oakwood St Inkster, MI | 3.0 | 1.5 | 912 | $1,600 | $1.75 | 1d | 1 | 1.13mi |
| 30520 Hiveley St Westland, MI | 3.0 | 1.0 | 1105 | $1,700 | $1.54 | 21d | 1 | 1.15mi |
| 1150 Magnolia Dr Inkster, MI | 3.0 | 1.0 | 900 | $1,300 | $1.44 | 24d | 1 | 1.16mi |
| 30043 Grandview St Unit 1 Inkster, MI | 3.0 | 1.5 | 1004 | $1,275 | $1.27 | 43d | 1 | 1.17mi |
| 29800 Oakwood St Inkster, MI | 3.0 | 1.0 | 1040 | $1,400 | $1.35 | 12d | 1 | 1.18mi |
| 31217 Cherry Hill Rd Westland, MI | 3.0 | 1.0 | 1100 | $1,800 | $1.64 | 4d | 1 | 1.29mi |
| 30010 Hazelwood St Inkster, MI | 3.0 | 1.0 | 1044 | $1,300 | $1.25 | 43d | 1 | 1.34mi |
| 27184 Lucerne Dr Inkster, MI | 3.0 | 1.0 | 1100 | $1,250 | $1.14 | 43d | 1 | 1.40mi |
| 7048 Deering St Garden City, MI | 3.0 | 1.0 | 910 | $1,500 | $1.65 | 17d | 1 | 1.48mi |
Listing history 5 events
-
2026-06-09status $229,000 Pending 3 DOM
-
2026-06-08days on market $229,000 Active 3 DOM
-
2026-06-07statusdays on market $229,000 Active 2 DOM
-
2026-06-04remarks 699-char remark
-
2026-06-04$229,000 Coming Soon 1 DOM
ⓘ Source: listings_history table (triggers on properties + properties_extension) + one-shot
backfill from property_details.listing_events for pre-trigger history.
Tax reassessment forecast MI · Partial reset (capped growth)
- Current annual tax
- $3,059 · $255/mo
- Projected year-2 tax
- $3,293 · $274/mo
- Expected delta
- +$234/yr (+$19/mo · 7.6%)
ⓘ Screening estimate from a state-policy table — verify with the county assessor before closing.
Climate risk First Street
- Flood 1/10 Low FEMA zone X (unshaded) · 0% chance over 30 yrs
- Wildfire 1/10 Low
- Heat 3/10 Moderate 7 d/yr ≥98°F today · 15 d/yr by 30 yrs out
- Wind 2/10 Low
- Air quality 2/10 Low 1 unhealthy d/yr today · 2 by 30 yrs out
Nearby sold comps map
Loading sold comps map…
Walkable amenities ~0.75 mi
Loading nearby amenities…
Taxation est. · year 1
- Rental income
- $23,255
- − Mortgage interest
- −$12,828
- − Property taxes
- −$3,059
- − Insurance
- −$1,145
- − Repairs & maintenance
- −$1,860
- − Management
- −$1,860
- − Depreciation
- −$6,662
- Taxable loss
- −$4,159
- Est. tax savings @ 24.0%
- +$998
- After-tax cash flow
- $755/yr
For passive investors: Depreciation is non-cash, so a rental often shows a tax loss while cash-flowing — sheltering income. Rental losses are passive: they offset passive income freely, and up to $25,000/yr can offset ordinary (W-2) income if you actively participate and your MAGI is under $100k (phasing out to $0 by $150k); unused losses carry forward. On sale, claimed depreciation is recaptured at up to 25%, and gains may owe capital-gains tax (a 1031 exchange can defer both). Figures are a year-1 estimate at your 24.0% rate — not tax advice; consult a CPA.
Schools (NCES district)
- District
- Garden City Public Schools
- NCES district ID
- 2615540
- Math proficiency
- 22% ▼ -11.00%
- Reading proficiency
- 36% ▼ -13.00%
- Median HH income
- $52,165
- Composite
- 25.53/100
- National rank
- #7433
- State rank
- #365 of 540 in MI
Livability — Garden City
- Score
- 82/100
- State rank
- #53
- US rank
- #1047
Category grades
Schools grade is shown separately in the Schools card above.
Census & demographics
- Census place
- Garden City, MI
- County
- Wayne County · 1,562,939 people
- City population
- 26,739
- Metro
- Detroit-Warren-Dearborn, MI
- Population (ZIP)
- 26,739
- Household income
- $67,294
- Rent vs Own
- Severe rent burden
- 509.0
Population outlook (Wayne County) Hauer SSP2
- Today (2025)
- 1,675,273 people
- By 2030
- 1,620,300 · -3.3%
- By 2040
- 1,502,341 · -10.3%
- By 2050
- 1,384,039 · -17.4%
- By 2075
- 1,124,592 · -32.9%
- By 2100
- 881,193 · -47.4%
Race, ethnicity, and origin ACS 2023
- Neighborhood character
- Predominantly White (82%)
- Race & ethnicity
- White 82% Two or more races 8% Black 7% Hispanic / Latino 5%
- Hispanic origin (detail)
- Mexican 5%
- Common ancestry
- Romanian 13% Italian 4% Slovak 3%
- Foreign-born
- 4% · Canada
- Languages at home
- 94% English-only · Arabic 3% Spanish 1% Other Indo-European 1%
Political lean MEDSL · Wayne
- 2024 margin
- Strong D (+29.0) · D 62.7% · R 33.7% · Other 3.6%
- 2008→2024 swing
- -20.5pp toward R · 2008: 49.5pp · 2024: 29.0pp
- All cycles
- 2024: D+29.0 2020: D+38.1 2016: D+37.3 2012: D+46.9 2008: D+49.5
Not yet ingested
- Civics
- —
Market trends
- HPI YoY
- ▼ -265.28%
- Current HPI
- 212.5713
- Rent YoY
- ▲ 3.65%
- Metro
- Detroit-Warren-Dearborn, MI
- State GDP YoY
- ▲ 1.37%
- F500 in state
- 28
Industry mix (Fortune 500 HQ in MI)
| Industry | F500 HQs | Revenue |
|---|---|---|
| Automotive Parts | 3 | $48B |
|
||
| Automotive | 2 | $372B |
|
||
| Chemicals | 1 | $45B |
|
||
| Automotive Retail | 1 | $29B |
|
||
| Healthcare / Medical Devices | 1 | $23B |
|
||
| Automotive Technology | 1 | $20B |
|
||
Price history
+263.5% since first listed23 events — show timeline
- 2026-06-03 Coming Soon $229,000 MiRealSource-MiMLS
- 2026-06-03 Coming Soon $229,000 SW Michigan MLS
- 2015-12-01 Listing Removed — REALCOMP
- 2015-11-30 Listing Removed — MiRealSource-MiMLS
- 2015-10-22 Price Changed $109,900 REALCOMP
- 2015-10-13 Listed $119,900 REALCOMP
- 2015-10-13 Listed $109,900 MiRealSource-MiMLS
- 2013-11-25 Listing Removed — MiRealSource-MiMLS
- 2013-11-22 Listing Removed — REALCOMP
- 2013-08-19 Listed $124,900 REALCOMP
- 2013-08-19 Listed $124,900 MiRealSource-MiMLS
- 2006-06-28 Listing Removed — REALCOMP
- 2006-06-02 Listing Removed — REALCOMP
- 2006-05-05 Listed $137,000 REALCOMP
- 2006-04-28 Listing Removed — REALCOMP
- 2006-04-28 Listed $139,000 REALCOMP
- 2006-02-02 Listing Removed — REALCOMP
- 2006-02-02 Listed $133,500 REALCOMP
- 2005-10-04 Listed $133,500 REALCOMP
- 2004-01-14 Sold (Public Records) $137,000 Public Records
- 2003-10-17 Sold (MLS) $137,000 REALCOMP
- 2003-07-07 Listed $134,900 REALCOMP
- 1993-04-28 Sold (Public Records) $63,000 Public Records
Property tax history
+3.3%/yrLatest (2025): $3,059 · +3.2% YoY. Source: county tax records.
Cash-flow waterfall
monthlySold comps — $/sqft
last 12 mo · ≤1 miLoading sold comps…