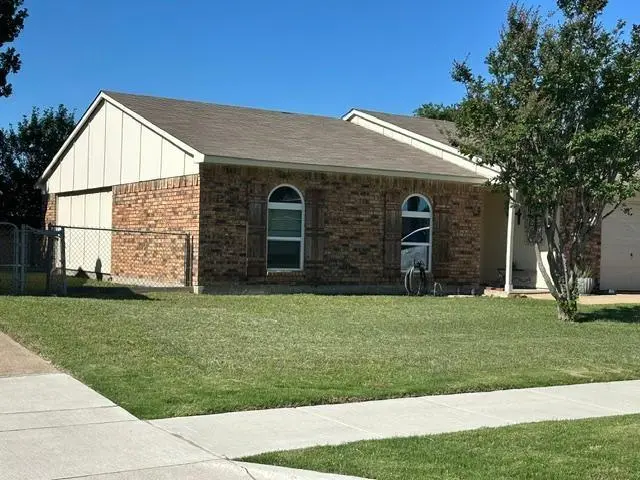
5232 Runyon Dr
The Colony, TX 75056
$259,900D+
3 bd · 2.0 ba ·
1,379 sqft ·
Built 1974
· SingleFamily
· Pending
· 6 DOM
Cashflow @ list (25.0% down · 7.5%)
Estimated rent
$2,300/mo
Mortgage (P&I)
−$1,363
Tax + insurance
−$474
HOA
−$0
Vac / Maint / Mgmt
−$483
Net cashflow
$-20/mo
Annual
$-237/yr
Cap rate
6.20%
Cash-on-cash
-0.33%
DSCR
0.99
1% rule
0.89%
Cash to close
$72,772
Investor read
- This is a 3-bed/2.0-bath single-family listed at $260k.
- At list price, monthly cash flow is $-20 ($-237/yr) — negative.
- To cash-flow at today's rent, offer at most $256k (1.3% below list).
- To meet the 1% rule (rent ≥ 1% of price), the offer needs to be $230k (11.5% below list).
- Only 6 days on market — expect competitive offers; lowballing is unlikely to land.
- Recommended offer: $230k (11.5% below list) — sets the bar for 1% rule.
- Local home prices are declining (-3.0%/yr); year-one equity from $2k of loan paydown is wiped out by about $8k of value loss. Plan a longer hold.
- Location reads 68/100 on livability (#464 in TX) — a middle-class / working-renter tenant base. Strengths: employment A+, housing A+, crime B+; Watch: amenities F, commute F.
- Lewisville ISD (suburban): math 49% / reading 54% proficiency, ranked #109 of 826 in TX (top 13%) — acceptable for families but not a draw, mixed tenant base, ~2y average lease.
- Zoned schools: Camey El (math 26% / reading 31%, grade F, #2,706 of 4,322 statewide, top 63%, 490 students, 63% FRL) — zoned schools average 63% FRL vs 26% district-wide (37 pts higher); higher-poverty schools than district average — tighter screening recommended.
- Zoned-school proficiency averages 28% at this address vs 52% district-wide (-23 pts) — the specific schools serving this property underperform the Lewisville ISD average; the district grade overstates school quality for this exact location.
- Market conditions: Rents soft (-1.0%/yr); 427 active listings in the ZIP; 40 comparable units currently listed for rent nearby; rentals at typical pace (median 18d on market — plan ~3-4 weeks tenant-placement turnaround); high-income renter base; 10,531 units permitted in Denton County in 2024 (2,713 in 5+ unit buildings).
- Denton County population projected at +66% by 2050 — long-run rental-demand tailwind backs the buy-and-hold thesis.
- Climate carrying-cost: moderate wind risk, 24% chance of damaging wind over 30y; extreme-heat days projected 7→22/yr by 2055 (HVAC capex compounding) — expect insurance premiums to compound above CPI over the hold.
- Cap rate 6.2% vs local median 2.9% in The Colony — top-decile yield for the area; either an underpriced asset or a hidden risk that comps aren't pricing in. Stress-test before assuming the spread holds.
Questions for listing agent
- What do current leases actually rent for vs. the listed asking? Can we see a recent rent roll and the last 12 months of T-12 income?
- Built in 1974 — when were the roof, HVAC, electrical panel, plumbing, and water heater last replaced?
- Is there a deadline driving the sale (1031 exchange, divorce, estate, relocation)? That informs how much negotiation room exists.
- Schools are B-rated — typically a magnet for longer-tenancy family renters. What's the average tenant stay here, and is there a school-zone premium baked into asking?
- The area grade is low — what's the realistic commute time and amenity access for the typical tenant pool here? Any planned neighborhood developments (good or bad) we should know about?
- What's the average days-on-market for RENTAL listings here right now (not sales)? A rising rental-DOM trend means longer vacancies and softer asking-rent achievability than the comps imply.
- What's the recent tenant-quality profile in this submarket — average credit score on applications, eviction rate, late-payment / NSF rate, and stable-employment percentage? A property-management company in the area should have these aggregated.
- How much new for-sale + rental construction is in the pipeline within 1–3 miles? Heavy new supply typically softens prices + rents 12–24 months out; constrained supply supports both.
CashFlowRE · CFR-P48ZXR5GBN2CV2
· Data 1 week ago
cashflowre.app · 2026-05-29