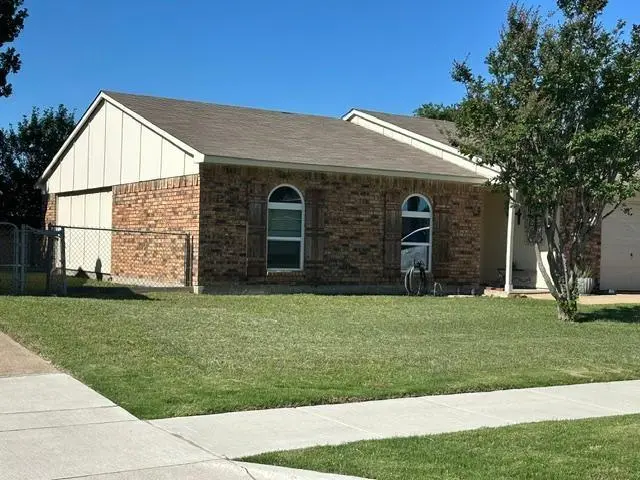
5232 Runyon Dr · The Colony, TX
Flood risk 1/10 · Minimal
- FEMA flood zone
- X (unshaded)
- Chance of flooding over 30 yrs
- 0.0%
- Est. flood insurance / yr
- $507 – $1,088
Fire risk 1/10 · Minimal
- Est. fire insurance / yr
- $1,222 – $2,270
Heat risk 7/10 · Major
- Hot days now (above 110°F)
- 7 days/yr
- Hot days in 30 yrs
- 22 days/yr
Wind risk 5/10 · Moderate
- Chance of severe wind over 30 yrs
- 24.0%
Air-quality risk 4/10 · Minor
- Unhealthy air days now
- 4 days/yr
- Unhealthy air days in 30 yrs
- 5 days/yr
Risk factors via First Street. Map © Google.
Why this score? — see what drove the D+ grade
The composite is a weighted blend of 9 inputs, each scored 0–100. Each bar is that input's sub-score; the figure is the points it added to the 100-point composite (weight × sub-score).
- ARV discount +13.9/15.0
- Cash flow +12.9/30.0
- Schools +4.7/10.0
- 1% rule +3.9/10.0
- DSCR +3.9/10.0
- Livability +3.4/5.0
- Condition / age +2.5/5.0
- Rent growth +2.2/5.0
- Appreciation +0.0/10.0
$259,900
🖨 Deal sheet 📄 Offer letter ✓ Due diligence
Listing remarks
Welcome to this great opportunity in a prime location for investment, or personal cozy three bedroom home with a little TLC. NEW ROOF will be installed shortly, windows replaced, flooring updated. Close to Hwy 121, Hawaiian Falls, near major retail, shopping, dining, and zoned in highly regarded Lewisville ISD schools. Presently leased until November but tenants may be negotiable. Please see Transaction Desk for important additional information
Key facts
- Windows replaced
- Flooring updated
- Prime location
Tags
Property features AI
Finance
- Other: Possession negotiable; may include closing/funding or lease outstanding; All tenants' possessions are excluded
- Financial info: Listing terms: Cash or Conventional
- HOA & community: No association
Exterior
- Parking: Attached garage with 1 garage space; Garage door opener; Garage faces front; 2-car single door (garage dimensions approx. 16' wide x 20' long x 8' high); Driveway
- Utilities: City water; City sewer; Cable available
- Home design: Single family residence; One story; Preowned (built in 1974); Subdivision: Colony 5
- Construction: Brick and siding exterior; Composition/shingle roof; Built in 1974
- Exterior features: Chain link fence; Interior lot in a subdivision; Alley access; Curbs and sidewalk
Interior
- Kitchen: Dishwasher; Disposal; Electric oven; Kitchen-level laundry area
- Bedrooms: 3 bedrooms (all on one level); Primary bedroom includes a walk-in closet
- Flooring: Vinyl flooring
- Bathrooms: 2 full bathrooms
- Heating & cooling: Electric heating; Electric cooling; Wood-burning fireplace in the living room
- Interior features: 5 total rooms; 1 living area; 1 dining area; Walk-in closet(s)
- Laundry & utility: Laundry located in the kitchen; Individual water meter
Neighborhood map
What this means for you Summary
Snapshot
- This is a 3-bed/2.0-bath single-family listed at $260k.
Deal economics
- At list price, monthly cash flow is $-20 ($-237/yr) — negative.
- To cash-flow at today's rent, offer at most $256k (1.3% below list).
- To meet the 1% rule (rent ≥ 1% of price), the offer needs to be $230k (11.5% below list).
- Recommended offer: $230k (11.5% below list) — sets the bar for 1% rule.
- Cap rate 6.2% vs local median 2.9% in The Colony — top-decile yield for the area; either an underpriced asset or a hidden risk that comps aren't pricing in. Stress-test before assuming the spread holds.
Location & tenants
- Location reads 68/100 on livability (#464 in TX) — a middle-class / working-renter tenant base. Strengths: employment A+, housing A+, crime B+; Watch: amenities F, commute F.
- Lewisville ISD (suburban): math 49% / reading 54% proficiency, ranked #109 of 826 in TX (top 13%) — acceptable for families but not a draw, mixed tenant base, ~2y average lease.
- Zoned schools: Camey El (math 26% / reading 31%, grade F, #2,706 of 4,322 statewide, top 63%, 490 students, 63% FRL) — zoned schools average 63% FRL vs 26% district-wide (37 pts higher); higher-poverty schools than district average — tighter screening recommended.
- Zoned-school proficiency averages 28% at this address vs 52% district-wide (-23 pts) — the specific schools serving this property underperform the Lewisville ISD average; the district grade overstates school quality for this exact location.
- Market conditions: Rents soft (-1.0%/yr); 427 active listings in the ZIP; 40 comparable units currently listed for rent nearby; rentals at typical pace (median 18d on market — plan ~3-4 weeks tenant-placement turnaround); high-income renter base; 10,531 units permitted in Denton County in 2024 (2,713 in 5+ unit buildings).
Forward outlook
- Local home prices are declining (-3.0%/yr); year-one equity from $2k of loan paydown is wiped out by about $8k of value loss. Plan a longer hold.
- Denton County population projected at +66% by 2050 — long-run rental-demand tailwind backs the buy-and-hold thesis.
Negotiation context
- Only 6 days on market — expect competitive offers; lowballing is unlikely to land.
Risks & watch-outs
- Climate carrying-cost: moderate wind risk, 24% chance of damaging wind over 30y; extreme-heat days projected 7→22/yr by 2055 (HVAC capex compounding) — expect insurance premiums to compound above CPI over the hold.
Questions for the listing agent
- What do current leases actually rent for vs. the listed asking? Can we see a recent rent roll and the last 12 months of T-12 income?
- Built in 1974 — when were the roof, HVAC, electrical panel, plumbing, and water heater last replaced?
- Is there a deadline driving the sale (1031 exchange, divorce, estate, relocation)? That informs how much negotiation room exists.
- Schools are B-rated — typically a magnet for longer-tenancy family renters. What's the average tenant stay here, and is there a school-zone premium baked into asking?
- The area grade is low — what's the realistic commute time and amenity access for the typical tenant pool here? Any planned neighborhood developments (good or bad) we should know about?
- What's the average days-on-market for RENTAL listings here right now (not sales)? A rising rental-DOM trend means longer vacancies and softer asking-rent achievability than the comps imply.
- What's the recent tenant-quality profile in this submarket — average credit score on applications, eviction rate, late-payment / NSF rate, and stable-employment percentage? A property-management company in the area should have these aggregated.
- How much new for-sale + rental construction is in the pipeline within 1–3 miles? Heavy new supply typically softens prices + rents 12–24 months out; constrained supply supports both.
Investment metrics
- 1% rule
- 0.89% ✗
- Cap rate
- 6.20%
- Cash-on-cash
- -0.33%
- DSCR
- 0.99
- GRM
- 9.4
CMA / ARV
- ARV (on-the-fly)
- $303,380
- Comps found
- 12
Show comp detail 12 sales within ~0.75 mi
| Address | Dist | Beds/Ba | Sqft | Sold | Price | $/sf | Match |
|---|---|---|---|---|---|---|---|
| 5134 Aztec Dr | 0.13mi | 3/2.0 | 1,335 (-3%) | 1mo | $310,000 | $232 | 88 |
| 5236 Arbor Glen Rd | 0.23mi | 3/2.0 | 1,379 (0%) | 5mo | $300,000 | $218 | 85 |
| 5220 Arbor Glen Rd | 0.23mi | 3/2.0 | 1,378 (-0%) | 5mo | $299,999 | $218 | 85 |
| 5113 Blue Glen Dr | 0.21mi | 3/2.0 | 1,335 (-3%) | 1mo | $295,000 | $221 | 84 |
| 5104 Aztec Dr | 0.22mi | 3/2.0 | 1,365 (-1%) | 6mo | $199,900 | $146 | 83 |
| 5321 Strickland Ave | 0.47mi | 3/2.0 | 1,379 (0%) | 0mo | $303,000 | $220 | 78 |
| 5040 S Colony Blvd | 0.40mi | 3/2.0 | 1,460 (+6%) | 2mo | $290,000 | $199 | 70 |
| 5325 Strickland Ave | 0.47mi | 3/2.0 | 1,335 (-3%) | 4mo | $248,700 | $186 | 70 |
| 5041 Avery Ln | 0.40mi | 3/2.0 | 1,460 (+6%) | 7mo | $359,500 | $246 | 66 |
| 5212 Knox Dr | 0.65mi | 3/2.0 | 1,379 (0%) | 4mo | $345,000 | $250 | 66 |
| 5229 Cook Cir | 0.47mi | 3/2.0 | 1,496 (+8%) | 1mo | $330,000 | $221 | 63 |
| 5208 Knox Dr | 0.66mi | 3/2.0 | 1,488 (+8%) | 1mo | $275,000 | $185 | 55 |
Match score weights: distance 35% · size 25% · config 20% · recency 20%. Top-matched comps best support the ARV.
Projected returns pro-forma
-3.0% appreciation · 0.0% rent growth · sell at horizon
- IRR
- -20.3%
- Equity multiple
- 0.31×
- Total profit
- $-50,055
- Equity at exit
- $38,752
- IRR
- -22.2%
- Equity multiple
- 0.02×
- Total profit
- $-71,017
- Equity at exit
- $22,471
Cash invested: $72,772 (down + closing). Projections, not guarantees.
Landlord ↔ Tenant lean methodology
- Overall (STATE)
- 87 Strongly Landlord-Friendly
- State Texas
- 87 Strongly Landlord-Friendly · R+5
- County
- — inherits STATE
- City
- — inherits STATE
ZIP-level market 75056
- Rents YoY
- -1.0%
- Active inventory
- 427
- Price-to-rent
- 9.4×
Monthly cashflow live
- Estimated rent
- $2,300 high interval (Pro) →
- Mortgage (P&I)
- −$1,363
- Tax from tax record
- −$366 /mo · $4,390/yr
- Insurance
- −$108
- HOA
- −$0
- Vacancy / Maint / Mgmt
- −$483
- Net cashflow
- $-20
Break-even live
UW: 25.0% down · 7.5% · 30yr · 1.5% tax · 5.0% vac · 8.0% maint · 8.0% mgmt
Financing live
Cash to close
- Down payment
- $64,975
- Closing costs
- $7,797
- Reserves months
- —
- Total cash needed
- —
Loan-product check · same deal, 3 products live
Conventional
25% down · 7.5% · 30yr
- Down + closing
- —
- Monthly P&I
- —
- Monthly cashflow
- —
- DSCR
- —
- Eligible?
- —
Personal DTI + credit; lowest rate.
DSCR
20% down · 8.5% · 30yr
- Down + closing
- —
- Monthly P&I
- —
- Monthly cashflow
- —
- DSCR
- —
- Eligible?
- —
No personal income docs; deal must DSCR.
Hard money
10% down · 12.0% · 12mo
- Down + closing
- —
- Monthly P&I
- —
- Monthly cashflow
- —
- DSCR
- —
- Eligible?
- —
Short-term bridge; refi at stabilization.
Rent comps 40 comps
| Address | Beds | Baths | Sqft | Rent | $/sqft | DOM | Units | Dist |
|---|---|---|---|---|---|---|---|---|
| 5225 Worley Dr The Colony, TX | 3.0 | 2.0 | 1379 | $2,100 | $1.52 | 17d | 1 | 0.03mi |
| 4905 Avery Cir The Colony, TX | 3.0 | 2.0 | 1460 | $2,150 | $1.47 | 17d | 1 | 0.20mi |
| 5229 Goodman Dr The Colony, TX | 3.0 | 2.0 | 1419 | $2,300 | $1.62 | 24d | 1 | 0.24mi |
| 4905 Avery Pl The Colony, TX | 3.0 | 2.0 | 1699 | $2,500 | $1.47 | 44d | 1 | 0.24mi |
| 5101 Aztec Dr The Colony, TX | 3.0 | 2.0 | 1379 | $2,250 | $1.63 | 44d | 1 | 0.27mi |
| 5112 Arbor Glen Rd The Colony, TX | 4.0 | 2.0 | 1850 | $4,500 | $2.43 | 44d | 1 | 0.28mi |
| 5060 Arbor Glen Rd The Colony, TX | 3.0 | 2.0 | 1359 | $2,050 | $1.51 | 10d | 1 | 0.33mi |
| 5161 Bartlett Dr The Colony, TX | 4.0 | 2.0 | 1856 | $2,700 | $1.45 | 44d | 1 | 0.38mi |
| 5033 Avery Ln The Colony, TX | 4.0 | 2.0 | 1856 | $2,395 | $1.29 | 3d | 1 | 0.43mi |
| 5620 S Colony Blvd The Colony, TX | 1.0–3.0 | 1.0–2.0 | 990 | $2,274 | $2.30 | 2d | 25 | 0.59mi |
| 4913 Alta Oaks Ln The Colony, TX | 3.0 | 2.0 | 1738 | $2,156 | $1.24 | 44d | 1 | 0.61mi |
| 5212 Knox Dr The Colony, TX | 3.0 | 2.0 | 1379 | $3,400 | $2.47 | 24d | 1 | 0.67mi |
| 6399 Morning Star Dr Unit 6456 The Colony, TX | 2.0 | 2.0 | 952 | $1,484 | $1.56 | 44d | 1 | 0.72mi |
| 6399 Morning Star Dr Unit 3121 The Colony, TX | 3.0 | 2.0 | 1292 | $1,797 | $1.39 | 3d | 1 | 0.72mi |
| 6399 Morning Star Dr Unit 6436 The Colony, TX | 2.0 | 2.0 | 1117 | $1,505 | $1.35 | 3d | 1 | 0.72mi |
| 6399 Morning Star Dr Unit 6432 The Colony, TX | 3.0 | 2.0 | 1292 | $1,840 | $1.42 | 5d | 1 | 0.72mi |
| 6399 Morning Star Dr The Colony, TX | 3.0 | 2.0 | 1292 | $2,099 | $1.62 | 21d | 1 | 0.73mi |
| 6399 Morning Star Dr The Colony, TX | 2.0 | 2.0 | 1171 | $1,678 | $1.43 | 24d | 1 | 0.73mi |
| 6399 Morning Star Dr The Colony, TX | 2.0 | 2.0 | 1117 | $1,625 | $1.45 | 3d | 1 | 0.73mi |
| 4828 Alta Oaks Ln The Colony, TX | 3.0 | 2.0 | 1699 | $2,200 | $1.29 | 44d | 1 | 0.73mi |
| 5721 Bandera Dr The Colony, TX | 3.0 | 2.0 | 1572 | $2,500 | $1.59 | 14d | 1 | 0.76mi |
| 4805 Alta Oaks Ln The Colony, TX | 4.0 | 3.0 | 1699 | $6,500 | $3.83 | 24d | 1 | 0.80mi |
| 4808 Arbor Glen Rd The Colony, TX | 4.0 | 2.0 | 1830 | $2,495 | $1.36 | 24d | 1 | 0.83mi |
| 6306 Cedar Falls Dr The Colony, TX | 3.0 | 3.0 | 1571 | $2,350 | $1.50 | 17d | 1 | 0.87mi |
| 5828 Clearwater Dr The Colony, TX | 2.0 | 2.0 | 1289 | $2,350 | $1.82 | 15d | 1 | 0.91mi |
| 5820 Stone Mountain Rd The Colony, TX | 3.0 | 2.5 | 1723 | $2,400 | $1.39 | 44d | 1 | 0.91mi |
| 5632 Overland Dr Unit NA The Colony, TX | 3.0 | 2.0 | 1772 | $2,500 | $1.41 | 4d | 1 | 0.93mi |
| 5632 Overland Dr The Colony, TX | 3.0 | 2.0 | 1772 | $2,500 | $1.41 | 5d | 1 | 0.93mi |
| 4777 Memorial Dr The Colony, TX | 2.0 | 2.0 | 1047 | $1,841 | $1.76 | 44d | 1 | 0.96mi |
| 4777 Memorial Dr The Colony, TX | 3.0 | 2.0 | 1370 | $2,325 | $1.70 | 12d | 1 | 0.96mi |
| 4777 Memorial Dr Unit 4834 The Colony, TX | 2.0 | 2.0 | 922 | $1,577 | $1.71 | 44d | 1 | 0.96mi |
| 4777 Memorial Dr Unit 2121 The Colony, TX | 2.0 | 2.0 | 922 | $1,577 | $1.71 | 14d | 1 | 0.96mi |
| 4777 Memorial Dr Unit 3121 The Colony, TX | 3.0 | 2.0 | 1370 | $2,361 | $1.72 | 3d | 1 | 0.96mi |
| 4777 Memorial Dr Unit 4800 The Colony, TX | 2.0 | 2.0 | 922 | $1,603 | $1.74 | 3d | 1 | 0.96mi |
| 4777 Memorial Dr Unit 4810 The Colony, TX | 3.0 | 2.0 | 1281 | $2,132 | $1.66 | 44d | 1 | 0.96mi |
| 5529 Gates Dr The Colony, TX | 3.0 | 2.0 | 1379 | $2,150 | $1.56 | 15d | 1 | 0.97mi |
| 5916 Clearwater Dr The Colony, TX | 3.0 | 2.5 | 1429 | $2,295 | $1.61 | 24d | 1 | 1.00mi |
| 5217 Gates Dr The Colony, TX | 3.0 | 2.0 | 1335 | $2,175 | $1.63 | 3d | 1 | 1.04mi |
| 5750 Grandscape Blvd Unit 5787 The Colony, TX | 2.0 | 2.0 | 1108 | $2,739 | $2.47 | 44d | 1 | 1.08mi |
| 5750 Grandscape Blvd Unit 2118 The Colony, TX | 2.0 | 2.0 | 1108 | $2,569 | $2.32 | 14d | 1 | 1.08mi |
Listing history 7 events
-
2026-06-08status $259,900 Pending 6 DOM
-
2026-06-07days on market $259,900 Active 6 DOM
-
2026-06-04days on market $259,900 Active 3 DOM
-
2026-06-03days on market $259,900 Active 2 DOM
-
2026-06-02remarks 449-char remark
-
2026-06-01remarks 446-char remark
-
2026-06-01$259,900 Active 1 DOM
ⓘ Source: listings_history table (triggers on properties + properties_extension) + one-shot
backfill from property_details.listing_events for pre-trigger history.
Tax reassessment forecast TX · Resets to sale price
- Current annual tax
- $4,390 · $366/mo
- Projected year-2 tax
- $4,756 · $396/mo
- Expected delta
- +$367/yr (+$31/mo · 8.4%)
ⓘ Screening estimate from a state-policy table — verify with the county assessor before closing.
Climate risk First Street
- Flood 1/10 Low FEMA zone X (unshaded) · 0% chance over 30 yrs
- Wildfire 1/10 Low
- Heat 7/10 Severe 7 d/yr ≥110°F today · 22 d/yr by 30 yrs out
- Wind 5/10 Major 24% chance of damaging wind over 30 yrs
- Air quality 4/10 Moderate 4 unhealthy d/yr today · 5 by 30 yrs out
Nearby sold comps map
Loading sold comps map…
Walkable amenities ~0.75 mi
Loading nearby amenities…
Taxation est. · year 1
- Rental income
- $27,604
- − Mortgage interest
- −$14,558
- − Property taxes
- −$4,390
- − Insurance
- −$1,300
- − Repairs & maintenance
- −$2,208
- − Management
- −$2,208
- − Depreciation
- −$7,561
- Taxable loss
- −$4,621
- Est. tax savings @ 24.0%
- +$1,109
- After-tax cash flow
- $872/yr
For passive investors: Depreciation is non-cash, so a rental often shows a tax loss while cash-flowing — sheltering income. Rental losses are passive: they offset passive income freely, and up to $25,000/yr can offset ordinary (W-2) income if you actively participate and your MAGI is under $100k (phasing out to $0 by $150k); unused losses carry forward. On sale, claimed depreciation is recaptured at up to 25%, and gains may owe capital-gains tax (a 1031 exchange can defer both). Figures are a year-1 estimate at your 24.0% rate — not tax advice; consult a CPA.
Schools (NCES district)
- District
- Lewisville ISD
- NCES district ID
- 4827300
- Math proficiency
- 49% ▼ -10.00%
- Reading proficiency
- 54% ▼ -4.00%
- Median HH income
- $82,351
- Composite
- 47.1/100
- National rank
- #2333
- State rank
- #109 of 826 in TX
Livability — The Colony
- Score
- 68/100
- State rank
- #464
- US rank
- #9336
Category grades
Schools grade is shown separately in the Schools card above.
Census & demographics
- Census place
- The Colony, TX
- County
- Denton County · 901,654 people
- City population
- 69,628
- Metro
- Dallas-Fort Worth-Arlington, TX
- Population (ZIP)
- 69,628
- Household income
- $119,682
- Rent vs Own
- Severe rent burden
- 1704.0
Population outlook (Denton County) Hauer SSP2
- Today (2025)
- 1,053,010 people
- By 2030
- 1,192,269 · +13.2%
- By 2040
- 1,472,920 · +39.9%
- By 2050
- 1,746,506 · +65.9%
- By 2075
- 2,358,497 · +124.0%
- By 2100
- 2,779,183 · +163.9%
Race, ethnicity, and origin ACS 2023
- Neighborhood character
- Diverse neighborhood (Simpson 0.69)
- Race & ethnicity
- White 49% Hispanic / Latino 18% Asian 17% Two or more races 13% Black 10%
- Hispanic origin (detail)
- Mexican 12% Cuban 1%
- Common ancestry
- Slovak 2% Italian 1% Lithuanian 1%
- Foreign-born
- 19% · Canada, South Korea, China
- Languages at home
- 73% English-only · Spanish 11% Other Indo-European 5% Other Asian/Pacific 4%
Political lean MEDSL · Denton
- 2024 margin
- R (+13.2) · D 42.7% · R 55.8% · Other 1.5%
- 2008→2024 swing
- +11.0pp toward D · 2008: -24.2pp · 2024: -13.2pp
- All cycles
- 2024: R+13.2 2020: R+8.1 2016: R+20.2 2012: R+31.7 2008: R+24.2
Not yet ingested
- Civics
- —
Market trends
- HPI YoY
- ▼ -235.14%
- Current HPI
- 288.9388
- Rent YoY
- ▼ -1.02%
- Metro
- Dallas-Fort Worth-Arlington, TX
- State GDP YoY
- ▲ 3.95%
- F500 in state
- 110
Industry mix (Fortune 500 HQ in TX)
| Industry | F500 HQs | Revenue |
|---|---|---|
| Energy | 16 | $1,198B |
|
||
| Technology | 5 | $198B |
|
||
| Engineering / Construction | 4 | $72B |
|
||
| Energy Services | 3 | $60B |
|
||
| Utilities | 3 | $41B |
|
||
| Healthcare | 2 | $330B |
|
||
Price history
2 events — show timeline
- 2026-06-01 Listed $259,900 NTREIS
- 1984-09-18 Sold (Public Records) — Public Records
Property tax history
+4.6%/yrLatest (2025): $4,390 · -13.7% YoY. Source: county tax records.
Cash-flow waterfall
monthlySold comps — $/sqft
last 12 mo · ≤1 miLoading sold comps…