139 Segovia Ct
Vacaville, CA 95687
$189,000B
3 bd · 2.0 ba ·
1,536 sqft ·
Built 1974
· Manufactured
· Pending
· 29 DOM
Cashflow @ list (25.0% down · 7.5%)
Estimated rent
$3,286/mo
Mortgage (P&I)
−$991
Tax + insurance
−$315
HOA
−$0
Vac / Maint / Mgmt
−$690
Net cashflow
$1,290/mo
Annual
$15,476/yr
Cap rate
14.48%
Cash-on-cash
29.24%
DSCR
2.30
1% rule
1.74%
Cash to close
$52,920
Investor read
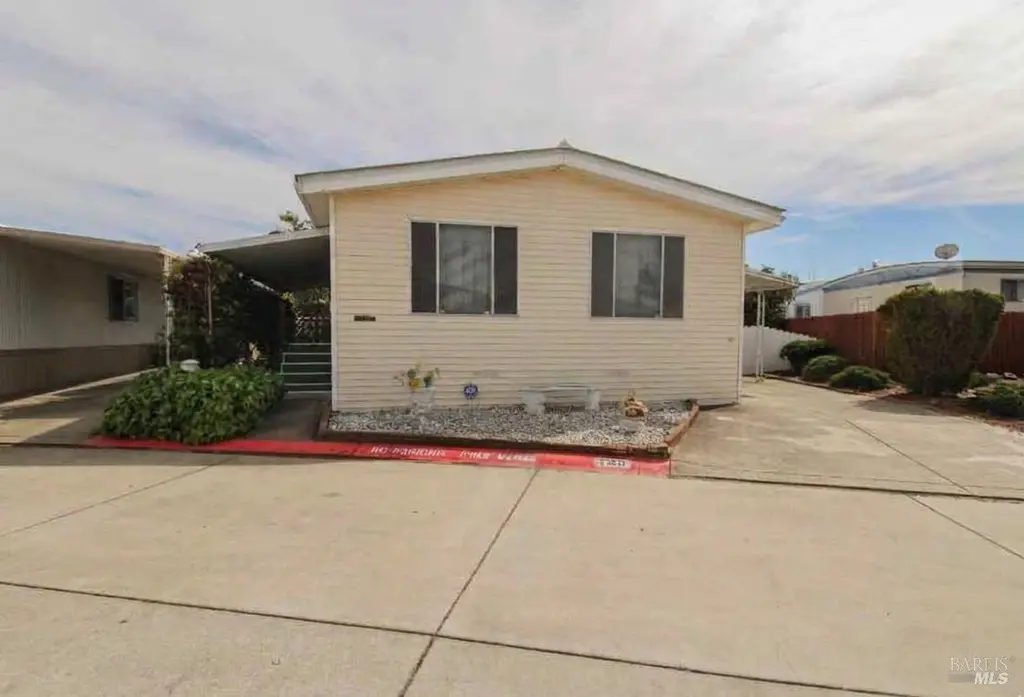
- This is a 3-bed/2.0-bath manufactured listed at $189k. Condition is rated fair.
- At list price, monthly cash flow is $1k ($15k/yr) — positive.
- The deal already cash-flows at list — no discount required.
- Meets the 1% rule at list price ($3k rent vs $189k).
- It's been on market 29 days — a 2% lower offer ($186k) is reasonable based on typical stale-listing flexibility.
- Recommended offer: $186k (1.5% below list) — sets the bar for market timing.
- Local home prices are declining (-3.0%/yr); year-one equity from $1k of loan paydown is wiped out by about $6k of value loss. Plan a longer hold.
- Location reads 77/100 on livability (#88 in CA, #3,156 nationally) — a middle-class / working-renter tenant base. Strengths: amenities A+, employment A+, housing A+; Watch: schools C-, cost of living F.
- Travis Unified (urban): math 42% / reading 56% proficiency, ranked #375 of 1,400 in CA (top 27%) — families likely to look elsewhere, expect single-tenant / working-renter base with shorter leases; only 18% free/reduced lunch — higher-income household profile.
- Market conditions: Rents soft (-0.6%/yr); 263 active listings in the ZIP; 8 comparable units currently listed for rent nearby; rentals lingering (median 44d on market — plan ~5-8 weeks vacancy on turnover, expect pricing pressure); 50% of comp listings sitting > 30 days — soft ceiling on asking rent; solid renter incomes; 1,472 units permitted in Solano County in 2024 (131 in 5+ unit buildings).
- Solano County population projected at +15% by 2050 — modest demand growth; plan on rents tracking national, not racing it.
- At projected returns (-3.0% appreciation + 0.0% rent growth), your $53k cash investment doubles in ~5 years — after that, you're playing with house money.
- Climate carrying-cost: moderate wildfire risk; extreme-heat days projected 7→14/yr by 2055 (HVAC capex compounding) — expect insurance premiums to compound above CPI over the hold.
- Cap rate 14.5% vs local median 3.0% in Vacaville — top-decile yield for the area; either an underpriced asset or a hidden risk that comps aren't pricing in. Stress-test before assuming the spread holds.
- This rent runs 36% of the median local income ($110k/yr) — at the standard rent-burdened threshold; future hikes will face affordability resistance.
Questions for listing agent
- Have any recent inspections been done? Can we get a copy of the seller's disclosures and any deferred-maintenance estimates?
- Built in 1974 — when were the roof, HVAC, electrical panel, plumbing, and water heater last replaced?
- Is there a deadline driving the sale (1031 exchange, divorce, estate, relocation)? That informs how much negotiation room exists.
- What's the average days-on-market for RENTAL listings here right now (not sales)? A rising rental-DOM trend means longer vacancies and softer asking-rent achievability than the comps imply.
- What's the recent tenant-quality profile in this submarket — average credit score on applications, eviction rate, late-payment / NSF rate, and stable-employment percentage? A property-management company in the area should have these aggregated.
- How much new for-sale + rental construction is in the pipeline within 1–3 miles? Heavy new supply typically softens prices + rents 12–24 months out; constrained supply supports both.
Repairs flagged (vision-AI assessment)
- Minor: Landscaping — Some bushes appear dry
- Minor: Paint — Light yellow siding shows some discoloration
CashFlowRE · CFR-P4EZXV470SS4AK
· Data 3 weeks ago
cashflowre.app · 2026-05-29