139 Segovia Ct · Vacaville, CA
Flood risk 1/10 · Minimal
- FEMA flood zone
- X (shaded)
- Chance of flooding over 30 yrs
- 0.0%
- Est. flood insurance / yr
- $507 – $1,088
Fire risk 5/10 · Moderate
- Est. fire insurance / yr
- $659 – $1,223
Heat risk 6/10 · Moderate
- Hot days now (above 100°F)
- 7 days/yr
- Hot days in 30 yrs
- 14 days/yr
Wind risk 1/10 · Minimal
- Chance of severe wind over 30 yrs
- —
Air-quality risk 10/10 · Severe
- Unhealthy air days now
- 22 days/yr
- Unhealthy air days in 30 yrs
- 23 days/yr
Risk factors via First Street. Map © Google.
Why this score? — see what drove the B grade
The composite is a weighted blend of 9 inputs, each scored 0–100. Each bar is that input's sub-score; the figure is the points it added to the 100-point composite (weight × sub-score).
- Cash flow +30.0/30.0
- 1% rule +10.0/10.0
- DSCR +10.0/10.0
- ARV discount +7.5/15.0
- Schools +4.8/10.0
- Livability +3.9/5.0
- Rent growth +2.4/5.0
- Condition / age +2.2/5.0
- Appreciation +0.0/10.0
$189,000
🖨 Deal sheet 📄 Offer letter ✓ Due diligence
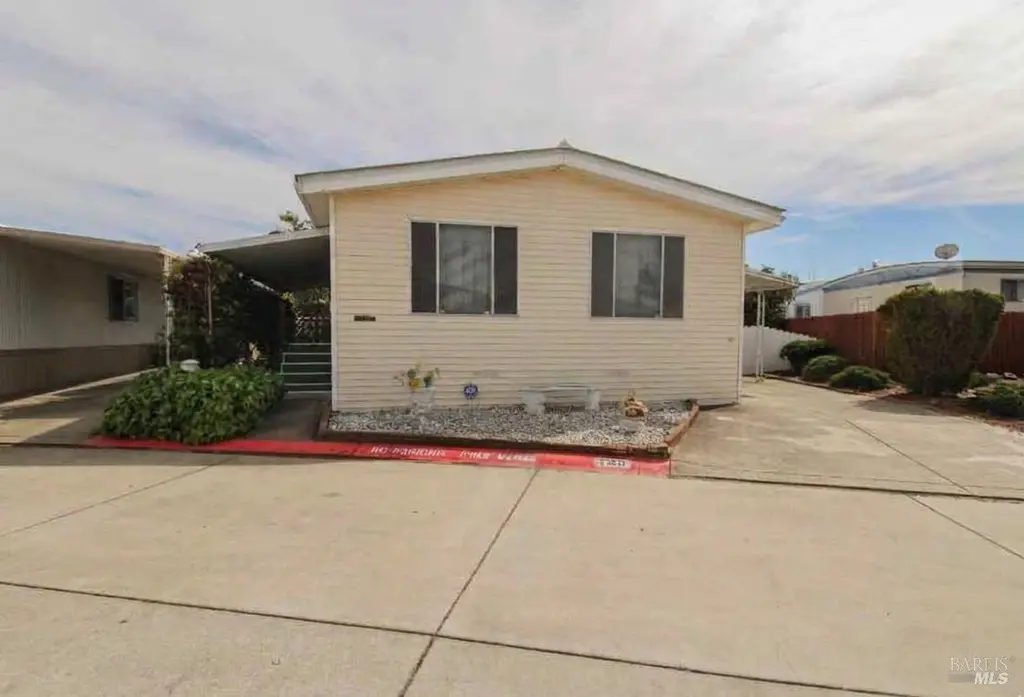
Listing remarks
This 3 bedroom, 2 bathroom home offers great space and potential in a highly desirable family community. Built in 1974 and in original condition, this home is perfect for buyers looking to customize and add their personal touch. Features include a spacious and open living room with fireplace, abundant natural light, and built-in shelving for added character. The kitchen and living areas feel open and airy, ideal for everyday living. The home offers generously sized bedrooms, including a large primary suite with double sinks and ample closet space. Additional highlights include a spacious laundry room with sink and plenty of storage, central AC, ceiling fans, and a low-maintenance yard with
Key facts
- Low maintenance yard
- Built in shelving
- Orange tree
Tags
Neighborhood map
What this means for you Summary
Snapshot
- This is a 3-bed/2.0-bath manufactured listed at $189k. Condition is rated fair.
Deal economics
- At list price, monthly cash flow is $1k ($15k/yr) — positive.
- The deal already cash-flows at list — no discount required.
- Meets the 1% rule at list price ($3k rent vs $189k).
- Recommended offer: $186k (1.5% below list) — sets the bar for market timing.
- Cap rate 14.5% vs local median 3.0% in Vacaville — top-decile yield for the area; either an underpriced asset or a hidden risk that comps aren't pricing in. Stress-test before assuming the spread holds.
Location & tenants
- Location reads 77/100 on livability (#88 in CA, #3,156 nationally) — a middle-class / working-renter tenant base. Strengths: amenities A+, employment A+, housing A+; Watch: schools C-, cost of living F.
- Travis Unified (urban): math 42% / reading 56% proficiency, ranked #375 of 1,400 in CA (top 27%) — families likely to look elsewhere, expect single-tenant / working-renter base with shorter leases; only 18% free/reduced lunch — higher-income household profile.
- Market conditions: Rents soft (-0.6%/yr); 263 active listings in the ZIP; 8 comparable units currently listed for rent nearby; rentals lingering (median 44d on market — plan ~5-8 weeks vacancy on turnover, expect pricing pressure); 50% of comp listings sitting > 30 days — soft ceiling on asking rent; solid renter incomes; 1,472 units permitted in Solano County in 2024 (131 in 5+ unit buildings).
- This rent runs 36% of the median local income ($110k/yr) — at the standard rent-burdened threshold; future hikes will face affordability resistance.
Forward outlook
- Local home prices are declining (-3.0%/yr); year-one equity from $1k of loan paydown is wiped out by about $6k of value loss. Plan a longer hold.
- Solano County population projected at +15% by 2050 — modest demand growth; plan on rents tracking national, not racing it.
- At projected returns (-3.0% appreciation + 0.0% rent growth), your $53k cash investment doubles in ~5 years — after that, you're playing with house money.
Negotiation context
- It's been on market 29 days — a 2% lower offer ($186k) is reasonable based on typical stale-listing flexibility.
Risks & watch-outs
- Climate carrying-cost: moderate wildfire risk; extreme-heat days projected 7→14/yr by 2055 (HVAC capex compounding) — expect insurance premiums to compound above CPI over the hold.
Questions for the listing agent
- Have any recent inspections been done? Can we get a copy of the seller's disclosures and any deferred-maintenance estimates?
- Built in 1974 — when were the roof, HVAC, electrical panel, plumbing, and water heater last replaced?
- Is there a deadline driving the sale (1031 exchange, divorce, estate, relocation)? That informs how much negotiation room exists.
- What's the average days-on-market for RENTAL listings here right now (not sales)? A rising rental-DOM trend means longer vacancies and softer asking-rent achievability than the comps imply.
- What's the recent tenant-quality profile in this submarket — average credit score on applications, eviction rate, late-payment / NSF rate, and stable-employment percentage? A property-management company in the area should have these aggregated.
- How much new for-sale + rental construction is in the pipeline within 1–3 miles? Heavy new supply typically softens prices + rents 12–24 months out; constrained supply supports both.
Investment metrics
- 1% rule
- 1.74% ✓
- Cap rate
- 14.48%
- Cash-on-cash
- 29.24%
- DSCR
- 2.30
- GRM
- 4.8
CMA / ARV
No comps found within radius.
Projected returns pro-forma
-3.0% appreciation · 0.0% rent growth · sell at horizon
- IRR
- 20.2%
- Equity multiple
- 1.79×
- Total profit
- $41,935
- Equity at exit
- $28,181
- IRR
- 26.3%
- Equity multiple
- 2.99×
- Total profit
- $105,273
- Equity at exit
- $16,341
Cash invested: $52,920 (down + closing). Projections, not guarantees.
Landlord ↔ Tenant lean methodology
- Overall (STATE)
- 18 Strongly Tenant-Friendly
- State California
- 18 Strongly Tenant-Friendly · D+13
- County
- — inherits STATE
- City
- — inherits STATE
ZIP-level market 95687
- Rents YoY
- -0.6%
- Active inventory
- 263
- Price-to-rent
- 4.8×
Monthly cashflow live
- Estimated rent
- $3,286 high interval (Pro) →
- Mortgage (P&I)
- −$991
- Tax est. 1.5%
- −$236 /mo · $2,835/yr
- Insurance
- −$79
- HOA
- −$0
- Vacancy / Maint / Mgmt
- −$690
- Net cashflow
- $1,290
Break-even live
UW: 25.0% down · 7.5% · 30yr · 1.5% tax · 5.0% vac · 8.0% maint · 8.0% mgmt
Financing live
Cash to close
- Down payment
- $47,250
- Closing costs
- $5,670
- Reserves months
- —
- Total cash needed
- —
Loan-product check · same deal, 3 products live
Conventional
25% down · 7.5% · 30yr
- Down + closing
- —
- Monthly P&I
- —
- Monthly cashflow
- —
- DSCR
- —
- Eligible?
- —
Personal DTI + credit; lowest rate.
DSCR
20% down · 8.5% · 30yr
- Down + closing
- —
- Monthly P&I
- —
- Monthly cashflow
- —
- DSCR
- —
- Eligible?
- —
No personal income docs; deal must DSCR.
Hard money
10% down · 12.0% · 12mo
- Down + closing
- —
- Monthly P&I
- —
- Monthly cashflow
- —
- DSCR
- —
- Eligible?
- —
Short-term bridge; refi at stabilization.
Rent comps 8 comps
| Address | Beds | Baths | Sqft | Rent | $/sqft | DOM | Units | Dist |
|---|---|---|---|---|---|---|---|---|
| 660 Broadfork Cir Vacaville, CA | 4.0 | 2.0 | 1800 | $3,700 | $2.06 | 13d | 1 | 0.89mi |
| 273 Cask Dr Vacaville, CA | 3.0 | 2.5 | 2209 | $3,495 | $1.58 | 43d | 1 | 0.92mi |
| 432 Zachary Dr Vacaville, CA | 3.0 | 2.0 | 1100 | $2,850 | $2.59 | 43d | 1 | 1.15mi |
| 809 Cosmos Dr Vacaville, CA | 3.0 | 2.5 | 2154 | $3,700 | $1.72 | 13d | 1 | 1.24mi |
| 398 Aaron Cir Vacaville, CA | 3.0 | 3.0 | 1700 | $3,295 | $1.94 | 23d | 1 | 1.34mi |
| 208 Richard Pl Vacaville, CA | 3.0 | 2.0 | 1512 | $3,250 | $2.15 | 43d | 1 | 1.46mi |
| 245 Christine Dr Vacaville, CA | 3.0 | 2.0 | 1533 | $3,400 | $2.22 | 43d | 1 | 1.47mi |
| 642 Silvertop Way Vacaville, CA | 3.0 | 2.0 | 1692 | $2,995 | $1.77 | 23d | 1 | 1.50mi |
Listing history 2 events
-
2026-04-22status Pending
-
2026-03-24$189,000 Active
ⓘ Source: listings_history table (triggers on properties + properties_extension) + one-shot
backfill from property_details.listing_events for pre-trigger history.
Climate risk First Street
- Flood 1/10 Low FEMA zone X (shaded) · 0% chance over 30 yrs
- Wildfire 5/10 Major
- Heat 6/10 Major 7 d/yr ≥100°F today · 14 d/yr by 30 yrs out
- Wind 1/10 Low
- Air quality 10/10 Extreme 22 unhealthy d/yr today · 23 by 30 yrs out
Nearby sold comps map
Loading sold comps map…
Walkable amenities ~0.75 mi
Loading nearby amenities…
Taxation est. · year 1
- Rental income
- $39,430
- − Mortgage interest
- −$10,587
- − Property taxes
- −$2,835
- − Insurance
- −$945
- − Repairs & maintenance
- −$3,154
- − Management
- −$3,154
- − Depreciation
- −$5,498
- Taxable income
- $13,256
- Est. tax owed @ 24.0%
- −$3,182
- After-tax cash flow
- $12,295/yr
For passive investors: Depreciation is non-cash, so a rental often shows a tax loss while cash-flowing — sheltering income. Rental losses are passive: they offset passive income freely, and up to $25,000/yr can offset ordinary (W-2) income if you actively participate and your MAGI is under $100k (phasing out to $0 by $150k); unused losses carry forward. On sale, claimed depreciation is recaptured at up to 25%, and gains may owe capital-gains tax (a 1031 exchange can defer both). Figures are a year-1 estimate at your 24.0% rate — not tax advice; consult a CPA.
Condition & rehab AI · 6 photos
This 1974 manufactured home is in fair condition with cosmetic updates needed. Fresh paint and landscaping would significantly boost its resale and rental value.
Repairs flagged
- Minor Landscaping — Some bushes appear dry
- Minor Paint — Light yellow siding shows some discoloration
Value-add opportunities
- Both Paint the exterior — Fresh paint would improve curb appeal and home value
- Both Landscaping — A well-maintained garden would enhance curb appeal and attract potential buyers
Renovation cost estimate screening
| Repair item | Severity | Est. cost |
|---|---|---|
| Landscaping · Some bushes appear dry | Minor | $500–3,000 |
| Paint · Light yellow siding shows some discoloration | Minor | $500–3,000 |
| Total estimated repair cost · 2 items | $1,000–6,000 |
Value-add ROI direction
- Both Paint the exterior — Fresh paint would improve curb appeal and home value ↑
- Both Landscaping — A well-maintained garden would enhance curb appeal and attract potential buyers ↑
ⓘ Cost ranges are severity-bucket heuristics (US national rule-of-thumb). Get contractor quotes + a written scope before underwriting a rehab budget.
Schools (NCES district)
- District
- Travis Unified
- NCES district ID
- 0639630
- Math proficiency
- 42% ▬ 0.00%
- Reading proficiency
- 56% ▼ -1.00%
- Median HH income
- $87,341
- Composite
- 47.55/100
- National rank
- #4961
- State rank
- #375 of 1400 in CA
Livability — Vacaville
- Score
- 77/100
- State rank
- #88
- US rank
- #3156
Category grades
Schools grade is shown separately in the Schools card above.
Census & demographics
- Census place
- Vacaville, CA
- County
- Solano County · 433,239 people
- City population
- 109,591
- Metro
- Vallejo, CA
- Population (ZIP)
- 69,390
- Household income
- $109,566
- Rent vs Own
- Severe rent burden
- 1761.0
Population outlook (Solano County) Hauer SSP2
- Today (2025)
- 478,685 people
- By 2030
- 497,974 · +4.0%
- By 2040
- 528,515 · +10.4%
- By 2050
- 549,115 · +14.7%
- By 2075
- 587,229 · +22.7%
- By 2100
- 571,378 · +19.4%
Race, ethnicity, and origin ACS 2023
- Neighborhood character
- Highly diverse neighborhood (Simpson 0.71)
- Race & ethnicity
- White 44% Hispanic / Latino 26% Two or more races 13% Black 10% Asian 10% Native American 1%
- Hispanic origin (detail)
- Mexican 18% Puerto Rican 2%
- Common ancestry
- Italian 13% Lithuanian 2% Portuguese 1%
- Foreign-born
- 12% · Canada, China
- Languages at home
- 80% English-only · Spanish 12% Tagalog/Filipino 3% Other Indo-European 2%
Political lean MEDSL · Solano
- 2024 margin
- Strong D (+23.0) · D 60.0% · R 37.1% · Other 2.9%
- 2008→2024 swing
- -5.6pp toward R · 2008: 28.6pp · 2024: 23.0pp
- All cycles
- 2024: D+23.0 2020: D+30.3 2016: D+30.5 2012: D+28.1 2008: D+28.6
Not yet ingested
- Civics
- —
Market trends
- HPI YoY
- ▼ -299.59%
- Current HPI
- 268.0777
- Rent YoY
- ▼ -0.55%
- Metro
- Vallejo, CA
- State GDP YoY
- ▲ 3.21%
- F500 in state
- 116
Industry mix (Fortune 500 HQ in CA)
| Industry | F500 HQs | Revenue |
|---|---|---|
| Technology | 27 | $1,492B |
|
||
| Financial Services | 3 | $174B |
|
||
| Retail | 3 | $44B |
|
||
| Insurance | 3 | $26B |
|
||
| Media / Entertainment | 2 | $115B |
|
||
| Pharmaceuticals / Biotech | 2 | $62B |
|
||
Price history
2 events — show timeline
- 2026-04-22 Pending — BAREIS
- 2026-03-24 Listed $189,000 BAREIS
Cash-flow waterfall
monthlySold comps — $/sqft
last 12 mo · ≤1 miLoading sold comps…