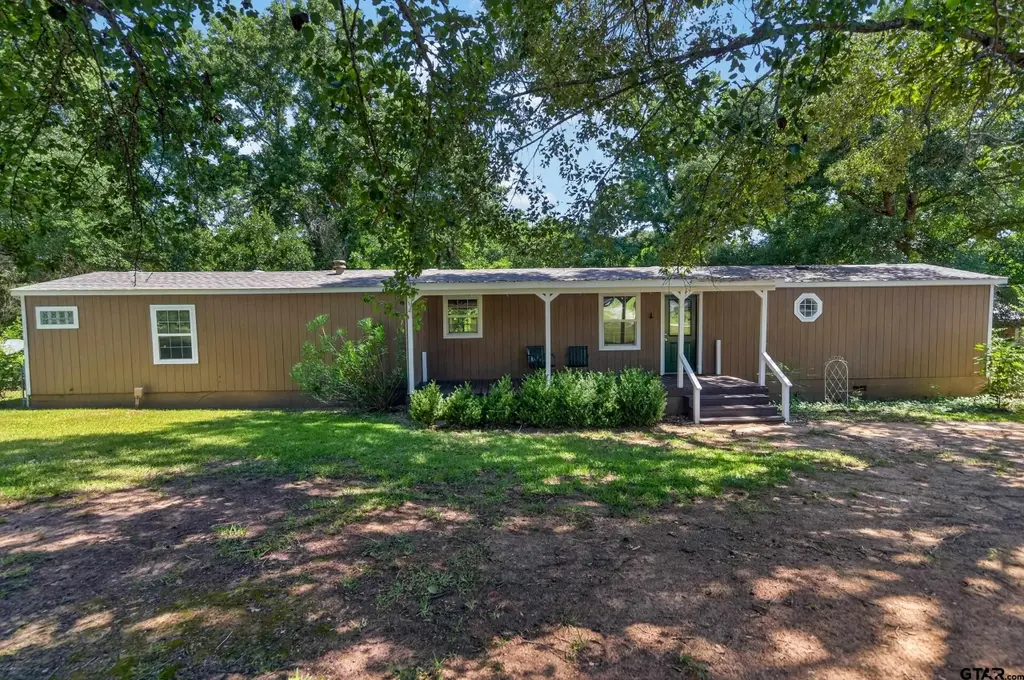
16091 Cedar Bay Dr
Emerald Bay, TX 75757
$138,000C-
3 bd · 2.0 ba ·
1,280 sqft ·
Built 1990
· Manufactured
· Active
· 1 DOM
Cashflow @ list (25.0% down · 7.5%)
Estimated rent
$1,273/mo
Mortgage (P&I)
−$724
Tax + insurance
−$115
HOA
−$0
Vac / Maint / Mgmt
−$267
Net cashflow
$167/mo
Annual
$2,001/yr
Cap rate
7.74%
Cash-on-cash
5.18%
DSCR
1.23
1% rule
0.92%
Cash to close
$38,640
Investor read
- This is a 3-bed/2.0-bath manufactured listed at $138k.
- At list price, monthly cash flow is $167 ($2k/yr) — positive.
- The deal already cash-flows at list — no discount required.
- To meet the 1% rule (rent ≥ 1% of price), the offer needs to be $127k (7.7% below list).
- Only 1 days on market — expect competitive offers; lowballing is unlikely to land.
- Recommended offer: $127k (7.7% below list) — sets the bar for 1% rule.
- Local home prices are declining (-3.0%/yr); year-one equity from $954 of loan paydown is wiped out by about $4k of value loss. Plan a longer hold.
- Location reads 71/100 on livability (#293 in TX) — a middle-class / working-renter tenant base. Strengths: crime A+, housing A+, employment A; Watch: amenities F, commute F, health & safety D-.
- Bullard ISD (rural): math 65% / reading 60% proficiency, ranked #48 of 826 in TX (top 6%) — acceptable for families but not a draw, mixed tenant base, ~2y average lease.
- Zoned schools: Bullard El (math 61% / reading 61%, grade B, #368 of 4,322 statewide, top 9%, 434 students, 36% FRL); Bullard Int (math 66% / reading 50%, grade B, #197 of 1,662 statewide, top 12%, 435 students, 26% FRL); Bullard H S (math 57% / reading 68%, grade B-, #234 of 1,632 statewide, top 14%, 848 students, 25% FRL).
- Market conditions: 581 active listings in the ZIP; 2 comparable units currently listed for rent nearby; 595 units permitted in Smith County in 2024 (45 in 5+ unit buildings).
- Smith County population projected at +24% by 2050 — long-run rental-demand tailwind backs the buy-and-hold thesis.
- Climate carrying-cost: major wind risk, 72% chance of damaging wind over 30y; extreme-heat days projected 7→26/yr by 2055 (HVAC capex compounding) — expect insurance premiums to compound above CPI over the hold.
- Cap rate 7.7% vs local median 2.9% in Emerald Bay — top-decile yield for the area; either an underpriced asset or a hidden risk that comps aren't pricing in. Stress-test before assuming the spread holds.
Questions for listing agent
- Is there a deadline driving the sale (1031 exchange, divorce, estate, relocation)? That informs how much negotiation room exists.
- This sits on a lake — are riparian / water-frontage rights deeded with the parcel? Any dock permits, shoreline easements, or HOA water-use restrictions?
- What's the documented flood / surge / shoreline-erosion history here (FEMA AND non-FEMA — e.g., storm surge, creek backup, septic-field saturation)?
- Any water-quality or seasonal algae-bloom issues that affect tenant satisfaction or short-term-rental demand?
- What's the average days-on-market for RENTAL listings here right now (not sales)? A rising rental-DOM trend means longer vacancies and softer asking-rent achievability than the comps imply.
- What's the recent tenant-quality profile in this submarket — average credit score on applications, eviction rate, late-payment / NSF rate, and stable-employment percentage? A property-management company in the area should have these aggregated.
- How much new for-sale + rental construction is in the pipeline within 1–3 miles? Heavy new supply typically softens prices + rents 12–24 months out; constrained supply supports both.
CashFlowRE · CFR-P79S90FC0T3MMC
· Data 1 day ago
cashflowre.app · 2026-05-29