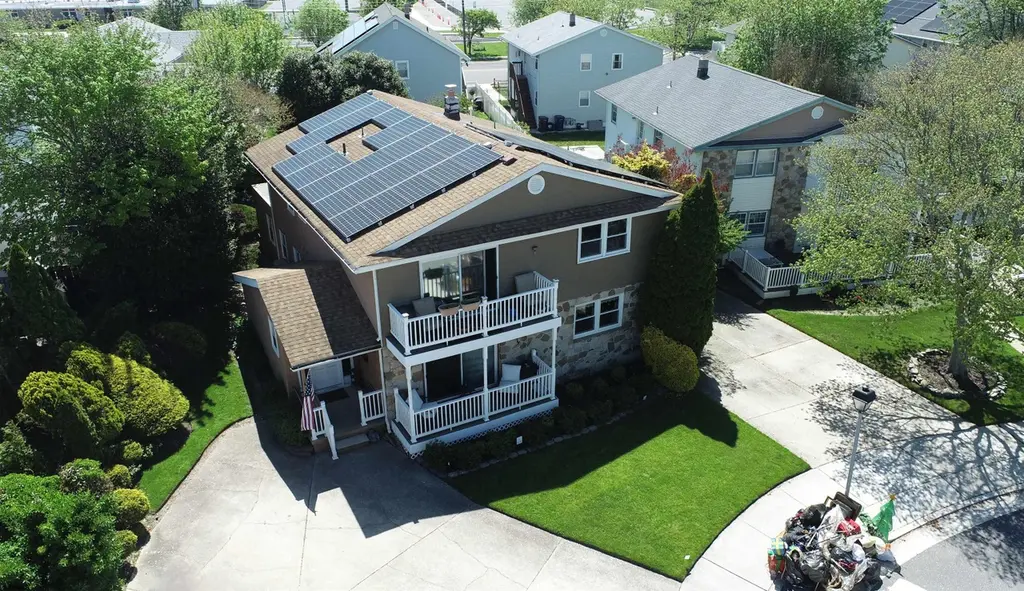
413-415 Berkshire Dr
Ventnor City, NJ 08406
$850,000D
5 bd · 4.0 ba ·
3,104 sqft ·
Built 1970
· SingleFamily
· Under Contract
· 39 DOM
Cashflow @ list (25.0% down · 7.5%)
Estimated rent
$6,225/mo
Mortgage (P&I)
−$4,457
Tax + insurance
−$1,508
HOA
−$0
Vac / Maint / Mgmt
−$1,307
Net cashflow
$-1,047/mo
Annual
$-12,566/yr
Cap rate
5.42%
Cash-on-cash
-3.13%
DSCR
0.86
1% rule
0.73%
Cash to close
$238,000
Investor read
- This is a 5-bed/4.0-bath single-family listed at $850k.
- At list price, monthly cash flow is $-1k ($-13k/yr) — negative.
- To cash-flow at today's rent, offer at most $665k (21.8% below list).
- To meet the 1% rule (rent ≥ 1% of price), the offer needs to be $623k (26.8% below list).
- It's been on market 39 days — a 3% lower offer ($824k) is reasonable based on typical stale-listing flexibility.
- Recommended offer: $623k (26.8% below list) — sets the bar for 1% rule.
- Local home prices are declining (-3.0%/yr); year-one equity from $6k of loan paydown is wiped out by about $26k of value loss. Plan a longer hold.
- Location reads 72/100 on livability (#202 in NJ) — a middle-class / working-renter tenant base. Strengths: health & safety A+, commute A-, crime B+; Watch: schools C-, amenities F, cost of living F.
- Ventnor City School District (suburban): math 27% / reading 49% proficiency, ranked #266 of 472 in NJ (top 56%) — families likely to look elsewhere, expect single-tenant / working-renter base with shorter leases.
- Watch-outs: flood insurance adds $427/mo.
- Market conditions: Rents rising fast (+57.3%/yr); 155 active listings in the ZIP; 11 comparable units currently listed for rent nearby; rentals at typical pace (median 21d on market — plan ~3-4 weeks tenant-placement turnaround); 672 units permitted in Atlantic County in 2024 (258 in 5+ unit buildings).
- Atlantic County population projected at -12% by 2050 — secular population decline; favor cash flow + early exit over multi-decade hold.
- Current owner paid $165k; list at $850k implies a 415% gain — meaningful room to come down on a strong offer.
- Climate carrying-cost: in FEMA flood zone AE (mandatory federal flood insurance); severe wind risk, 80% chance of damaging wind over 30y; extreme-heat days projected 7→16/yr by 2055 (HVAC capex compounding) — expect insurance premiums to compound above CPI over the hold.
- Cap rate 5.4% vs local median 4.1% in Ventnor City — top-decile yield for the area; either an underpriced asset or a hidden risk that comps aren't pricing in. Stress-test before assuming the spread holds.
- At $6,225/mo this rent would consume 108% of the median local household income ($69k/yr) (locally 329% of renters already pay >50% of income on rent) — very limited rent-growth headroom before tenants either downsize or default.
Questions for listing agent
- What do current leases actually rent for vs. the listed asking? Can we see a recent rent roll and the last 12 months of T-12 income?
- It's been on market 39 days. Have you received any prior offers? Is the seller open to a 27% concession, seller financing, or rate buy-down credit?
- Built in 1970 — when were the roof, HVAC, electrical panel, plumbing, and water heater last replaced?
- What's the actual annual flood-insurance premium (NFIP or private), and is the property in a SFHA with mandatory coverage?
- Is there a deadline driving the sale (1031 exchange, divorce, estate, relocation)? That informs how much negotiation room exists.
- The area grade is low — what's the realistic commute time and amenity access for the typical tenant pool here? Any planned neighborhood developments (good or bad) we should know about?
- What's the average days-on-market for RENTAL listings here right now (not sales)? A rising rental-DOM trend means longer vacancies and softer asking-rent achievability than the comps imply.
- What's the recent tenant-quality profile in this submarket — average credit score on applications, eviction rate, late-payment / NSF rate, and stable-employment percentage? A property-management company in the area should have these aggregated.
CashFlowRE · CFR-P7QKJK168MPKAX
· Data 1 day ago
cashflowre.app · 2026-05-29