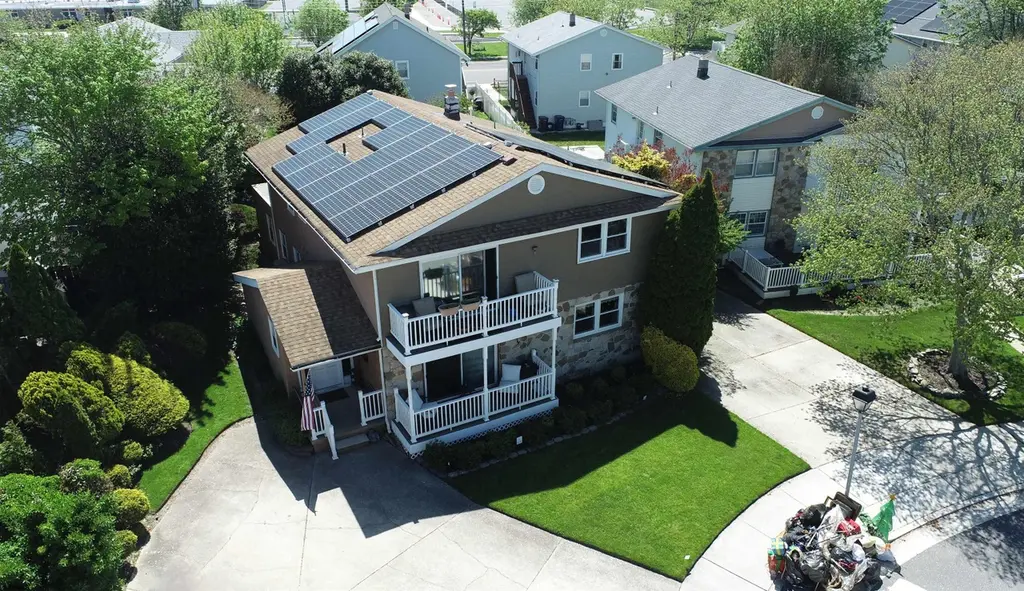
413-415 Berkshire Dr · Ventnor City, NJ
Flood risk 8/10 · Major
- FEMA flood zone
- AE
- Chance of flooding over 30 yrs
- 0.97%
- Est. flood insurance / yr
- $1,737 – $8,500
Fire risk 1/10 · Minimal
- Est. fire insurance / yr
- $526 – $976
Heat risk 9/10 · Severe
- Hot days now (above 95°F)
- 7 days/yr
- Hot days in 30 yrs
- 16 days/yr
Wind risk 8/10 · Major
- Chance of severe wind over 30 yrs
- 80.0%
Air-quality risk 2/10 · Minimal
- Unhealthy air days now
- 1 days/yr
- Unhealthy air days in 30 yrs
- 2 days/yr
Risk factors via First Street. Map © Google.
Why this score? — see what drove the D grade
The composite is a weighted blend of 9 inputs, each scored 0–100. Each bar is that input's sub-score; the figure is the points it added to the 100-point composite (weight × sub-score).
- ARV discount +15.0/15.0
- Cash flow +9.3/30.0
- Rent growth +5.0/5.0
- Livability +3.6/5.0
- Schools +3.3/10.0
- DSCR +2.6/10.0
- Condition / age +2.5/5.0
- 1% rule +2.3/10.0
- Appreciation +0.0/10.0
$850,000
🖨 Deal sheet 📄 Offer letter ✓ Due diligence
Listing remarks
DUPLEX located at 413-415 Berkshire Drive in offering approximately 3,104 sq. ft. of living space. This well-designed home features 5 bedrooms and 4 full bathrooms, including 3 bedrooms and 2 full baths on the first level, plus 2 additional bedrooms and 2 full baths on the second floor — ideal for large families, multi-generational living, or hosting guests comfortably. This home has seen several recent improvements, including a recently updated decks, newer roof, and solar system, adding both value and energy efficiency. Conveniently located near the Ventnor Elementary School and just minutes from beaches, shopping, dining, and entertainment. The property features a backyard with pl
Key facts
- Updated decks
- Newer roof
- Backyard
Tags
Property features AI
Exterior
- Parking: Exterior parking for three or more cars; No garage
- Utilities: Public water; Public sewer; Gas water heater
- Home design: Stone and vinyl siding; Zoned R6; For sale
- Construction: 25+ years old
- Exterior features: Deck; Fenced yard; Concrete driveway; Combination storms/screens; Mocha brown exterior
Interior
- Kitchen: Dishwasher; Electric stove; Gas stove; Microwave; Refrigerator
- Bedrooms: Total rooms: 15
- Flooring: Tile; Wall-to-wall carpet
- Bathrooms: 4 full bathrooms
- Heating & cooling: Central air conditioning; Natural gas heating
- Interior features: Dining room; Pantry; Recreation/family room; Crawl space basement
- Laundry & utility: Washer; Dryer
Neighborhood map
What this means for you Summary
Snapshot
- This is a 5-bed/4.0-bath single-family listed at $850k.
Deal economics
- At list price, monthly cash flow is $-1k ($-13k/yr) — negative.
- To cash-flow at today's rent, offer at most $665k (21.8% below list).
- To meet the 1% rule (rent ≥ 1% of price), the offer needs to be $623k (26.8% below list).
- Recommended offer: $623k (26.8% below list) — sets the bar for 1% rule.
- Cap rate 5.4% vs local median 4.1% in Ventnor City — top-decile yield for the area; either an underpriced asset or a hidden risk that comps aren't pricing in. Stress-test before assuming the spread holds.
Location & tenants
- Location reads 72/100 on livability (#202 in NJ) — a middle-class / working-renter tenant base. Strengths: health & safety A+, commute A-, crime B+; Watch: schools C-, amenities F, cost of living F.
- Ventnor City School District (suburban): math 27% / reading 49% proficiency, ranked #266 of 472 in NJ (top 56%) — families likely to look elsewhere, expect single-tenant / working-renter base with shorter leases.
- Market conditions: Rents rising fast (+57.3%/yr); 155 active listings in the ZIP; 11 comparable units currently listed for rent nearby; rentals at typical pace (median 21d on market — plan ~3-4 weeks tenant-placement turnaround); 672 units permitted in Atlantic County in 2024 (258 in 5+ unit buildings).
- At $6,225/mo this rent would consume 108% of the median local household income ($69k/yr) (locally 329% of renters already pay >50% of income on rent) — very limited rent-growth headroom before tenants either downsize or default.
Forward outlook
- Local home prices are declining (-3.0%/yr); year-one equity from $6k of loan paydown is wiped out by about $26k of value loss. Plan a longer hold.
- Atlantic County population projected at -12% by 2050 — secular population decline; favor cash flow + early exit over multi-decade hold.
Negotiation context
- It's been on market 39 days — a 3% lower offer ($824k) is reasonable based on typical stale-listing flexibility.
- Current owner paid $165k; list at $850k implies a 415% gain — meaningful room to come down on a strong offer.
Risks & watch-outs
- Watch-outs: flood insurance adds $427/mo.
- Climate carrying-cost: in FEMA flood zone AE (mandatory federal flood insurance); severe wind risk, 80% chance of damaging wind over 30y; extreme-heat days projected 7→16/yr by 2055 (HVAC capex compounding) — expect insurance premiums to compound above CPI over the hold.
Questions for the listing agent
- What do current leases actually rent for vs. the listed asking? Can we see a recent rent roll and the last 12 months of T-12 income?
- It's been on market 39 days. Have you received any prior offers? Is the seller open to a 27% concession, seller financing, or rate buy-down credit?
- Built in 1970 — when were the roof, HVAC, electrical panel, plumbing, and water heater last replaced?
- What's the actual annual flood-insurance premium (NFIP or private), and is the property in a SFHA with mandatory coverage?
- Is there a deadline driving the sale (1031 exchange, divorce, estate, relocation)? That informs how much negotiation room exists.
- The area grade is low — what's the realistic commute time and amenity access for the typical tenant pool here? Any planned neighborhood developments (good or bad) we should know about?
- What's the average days-on-market for RENTAL listings here right now (not sales)? A rising rental-DOM trend means longer vacancies and softer asking-rent achievability than the comps imply.
- What's the recent tenant-quality profile in this submarket — average credit score on applications, eviction rate, late-payment / NSF rate, and stable-employment percentage? A property-management company in the area should have these aggregated.
- How much new for-sale + rental construction is in the pipeline within 1–3 miles? Heavy new supply typically softens prices + rents 12–24 months out; constrained supply supports both.
Investment metrics
- 1% rule
- 0.73% ✗
- Cap rate
- 5.42%
- Cash-on-cash
- -3.13%
- DSCR
- 0.86
- GRM
- 11.4
CMA / ARV
- ARV (median comp)
- $1,548,813
- List price
- $850,000
- Delta
- -45.12%
- Verdict
- UNDERPRICED
- Comps
- 20 within 1.0 mi
Show comp detail 12 sales within ~0.75 mi
| Address | Dist | Beds/Ba | Sqft | Sold | Price | $/sf | Match |
|---|---|---|---|---|---|---|---|
| 6703 Monmouth Ave | 0.37mi | 5/3.5 | 2,788 (-10%) | 7mo | $2,160,000 | $775 | 58 |
| 420 N Delavan Ave | 0.50mi | 4/3.5 (-1) | 2,850 (-8%) | 1mo | $1,670,000 | $586 | 55 |
| 1 S Portland Ave | 0.69mi | 5/3.5 | 3,000 (-3%) | 11mo | $2,250,000 | $750 | 51 |
| 214 N Brunswick Dr | 0.40mi | 6/4.0 (+1) | 2,650 (-15%) | 1mo | $1,995,000 | $753 | 51 |
| 26 N Delavan Ave Ave | 0.61mi | 5/4.5 | 2,750 (-11%) | 0mo | $2,750,000 | $1,000 | 50 |
| 509 N Burghley Ave | 0.69mi | 4/3.5 (-1) | 3,000 (-3%) | 10mo | $1,500,000 | $500 | 46 |
| 21 N Douglas Ave | 0.63mi | 6/4.5 (+1) | 2,842 (-8%) | 4mo | $2,575,000 | $906 | 46 |
| 6511 Atlantic Ave | 0.69mi | 6/4.5 (+1) | 3,222 (+4%) | 12mo | $2,100,000 | $652 | 45 |
| 413 N Gladstone Ave | 0.65mi | 4/2.5 (-1) | 3,021 (-3%) | 13mo | $1,150,000 | $381 | 44 |
| 15 S New Haven Ave | 0.68mi | 5/4.0 | 3,497 (+13%) | 8mo | $1,900,000 | $543 | 40 |
| 14 N Cambridge Ave | 0.73mi | 4/3.0 (-1) | 2,808 (-10%) | 4mo | $1,210,000 | $431 | 38 |
| 105 S Fredericksburg Ave | 0.69mi | 4/4.5 (-1) | 3,471 (+12%) | 12mo | $2,125,000 | $612 | 31 |
Match score weights: distance 35% · size 25% · config 20% · recency 20%. Top-matched comps best support the ARV.
Projected returns pro-forma
-3.0% appreciation · 8.0% rent growth · sell at horizon
- IRR
- -19.8%
- Equity multiple
- 0.28×
- Total profit
- $-171,383
- Equity at exit
- $126,738
- IRR
- -4.5%
- Equity multiple
- 0.64×
- Total profit
- $-84,771
- Equity at exit
- $73,492
Cash invested: $238,000 (down + closing). Projections, not guarantees.
Landlord ↔ Tenant lean methodology
- Overall (STATE)
- 21 Tenant-Leaning
- State New Jersey
- 21 Tenant-Leaning · D+6
- County
- — inherits STATE
- City
- — inherits STATE
ZIP-level market 08406
- Home prices YoY
- -33.3%
- Rents YoY
- 57.3%
- Active inventory
- 155
- Price-to-rent
- 11.4×
Monthly cashflow live
- Estimated rent
- $6,225 medium interval (Pro) →
- Mortgage (P&I)
- −$4,457
- Tax from tax record
- −$727 /mo · $8,725/yr
- Insurance
- −$354
- Flood insurance flood zone
- −$427 /mo · $5,118/yr
- HOA
- −$0
- Vacancy / Maint / Mgmt
- −$1,307
- Net cashflow
- $-1,047
Break-even live
UW: 25.0% down · 7.5% · 30yr · 1.5% tax · 5.0% vac · 8.0% maint · 8.0% mgmt
Financing live
Cash to close
- Down payment
- $212,500
- Closing costs
- $25,500
- Reserves months
- —
- Total cash needed
- —
Loan-product check · same deal, 3 products live
Conventional
25% down · 7.5% · 30yr
- Down + closing
- —
- Monthly P&I
- —
- Monthly cashflow
- —
- DSCR
- —
- Eligible?
- —
Personal DTI + credit; lowest rate.
DSCR
20% down · 8.5% · 30yr
- Down + closing
- —
- Monthly P&I
- —
- Monthly cashflow
- —
- DSCR
- —
- Eligible?
- —
No personal income docs; deal must DSCR.
Hard money
10% down · 12.0% · 12mo
- Down + closing
- —
- Monthly P&I
- —
- Monthly cashflow
- —
- DSCR
- —
- Eligible?
- —
Short-term bridge; refi at stabilization.
Rent comps 11 comps
| Address | Beds | Baths | Sqft | Rent | $/sqft | DOM | Units | Dist |
|---|---|---|---|---|---|---|---|---|
| 111 N Belmont Ave Margate City, NJ | 5.0 | 3.5 | 3200 | $35,000 | $10.94 | 21d | 1 | 0.39mi |
| 6 Brunswick Ct Margate City, NJ | 5.0 | 2.5 | 3770 | $38,000 | $10.08 | 43d | 1 | 0.48mi |
| 6 Brunswick Ct Margate City, NJ | 5.0 | 2.5 | 3770 | $30,000 | $7.96 | 13d | 1 | 0.48mi |
| 7103 Ventnor Ave Ventnor City, NJ | 4.0 | 3.0 | 2288 | $5,500 | $2.40 | 13d | 1 | 0.51mi |
| 107 N Douglas Ave Unit AUGUST Margate City, NJ | 5.0 | 3.5 | 2312 | $33,000 | $14.27 | 21d | 1 | 0.55mi |
| 107 N Douglas Ave Margate City, NJ | 5.0 | 3.5 | 2312 | $36,000 | $15.57 | 43d | 1 | 0.55mi |
| 7611 Ventnor Ave Margate City, NJ | 6.0 | 4.0 | 2717 | $34,000 | $12.51 | 21d | 1 | 0.64mi |
| 802 N Harvard Ave Ventnor City, NJ | 6.0 | 4.0 | 4000 | $38,000 | $9.50 | 21d | 1 | 0.67mi |
| 8208 Lagoon Dr Margate City, NJ | 4.0 | 2.5 | 2480 | $18,000 | $7.26 | 13d | 1 | 0.90mi |
| 8606 Monmouth Ave Unit August 9/13 Margate City, NJ | 4.0 | 3.5 | 2430 | $20,000 | $8.23 | 43d | 1 | 1.11mi |
| 204 N Union Ave Margate City, NJ | 5.0 | 4.0 | 2393 | $5,000 | $2.09 | 43d | 1 | 1.37mi |
Listing history 18 events
-
2026-06-19days on market $850,000 Under Contract 39 DOM
-
2026-06-18days on market $850,000 Under Contract 38 DOM
-
2026-06-17days on market $850,000 Under Contract 37 DOM
-
2026-06-16days on market $850,000 Under Contract 36 DOM
-
2026-06-15days on market $850,000 Under Contract 35 DOM
-
2026-06-14days on market $850,000 Under Contract 33 DOM
-
2026-06-13days on market $850,000 Under Contract 32 DOM
-
2026-06-10days on market $850,000 Under Contract 30 DOM
-
2026-06-09days on market $850,000 Under Contract 29 DOM
-
2026-06-08days on market $850,000 Under Contract 28 DOM
-
2026-06-07days on market $850,000 Under Contract 27 DOM
-
2026-06-03days on market $850,000 Under Contract 23 DOM
-
2026-06-02days on market $850,000 Under Contract 22 DOM
-
2026-06-01days on market $850,000 Under Contract 21 DOM
-
2026-05-31days on market $850,000 Under Contract 20 DOM
-
2026-05-30days on market $850,000 Under Contract 19 DOM
-
2026-05-11$850,000 Active 775-char remark
-
1994-10-03soldstatus $165,000
ⓘ Source: listings_history table (triggers on properties + properties_extension) + one-shot
backfill from property_details.listing_events for pre-trigger history.
Tax reassessment forecast NJ · Partial reset (capped growth)
- Current annual tax
- $8,725 · $727/mo
- Projected year-2 tax
- $14,945 · $1,245/mo
- Expected delta
- +$6,220/yr (+$518/mo · 71.3%)
ⓘ Screening estimate from a state-policy table — verify with the county assessor before closing.
Climate risk First Street
- Flood 8/10 Severe FEMA zone AE · 97% chance over 30 yrs
- Wildfire 1/10 Low
- Heat 9/10 Extreme 7 d/yr ≥95°F today · 16 d/yr by 30 yrs out
- Wind 8/10 Severe 80% chance of damaging wind over 30 yrs
- Air quality 2/10 Low 1 unhealthy d/yr today · 2 by 30 yrs out
Nearby sold comps map
Loading sold comps map…
Walkable amenities ~0.75 mi
Loading nearby amenities…
Taxation est. · year 1
- Rental income
- $74,705
- − Mortgage interest
- −$47,613
- − Property taxes
- −$8,725
- − Insurance
- −$9,368
- − Repairs & maintenance
- −$5,976
- − Management
- −$5,976
- − Depreciation
- −$24,727
- Taxable loss
- −$27,682
- Est. tax savings @ 24.0%
- +$6,644
- After-tax cash flow
- $-5,923/yr
For passive investors: Depreciation is non-cash, so a rental often shows a tax loss while cash-flowing — sheltering income. Rental losses are passive: they offset passive income freely, and up to $25,000/yr can offset ordinary (W-2) income if you actively participate and your MAGI is under $100k (phasing out to $0 by $150k); unused losses carry forward. On sale, claimed depreciation is recaptured at up to 25%, and gains may owe capital-gains tax (a 1031 exchange can defer both). Figures are a year-1 estimate at your 24.0% rate — not tax advice; consult a CPA.
Schools (NCES district)
- District
- Ventnor City School District
- NCES district ID
- 3416680
- Math proficiency
- 27% ▼ -18.00%
- Reading proficiency
- 49% ▼ -7.00%
- Median HH income
- $52,220
- Composite
- 32.96/100
- National rank
- #5588
- State rank
- #266 of 472 in NJ
Livability — Ventnor City
- Score
- 72/100
- State rank
- #202
- US rank
- #5716
Category grades
Schools grade is shown separately in the Schools card above.
Census & demographics
- Census place
- Ventnor City, NJ
- County
- Atlantic County · 143,611 people
- City population
- 8,972
- Metro
- Atlantic City-Hammonton, NJ
- Population (ZIP)
- 8,972
- Household income
- $69,099
- Rent vs Own
- Severe rent burden
- 329.0
Population outlook (Atlantic County) Hauer SSP2
- Today (2025)
- 268,948 people
- By 2030
- 264,497 · -1.7%
- By 2040
- 252,261 · -6.2%
- By 2050
- 237,846 · -11.6%
- By 2075
- 210,650 · -21.7%
- By 2100
- 180,234 · -33.0%
Race, ethnicity, and origin ACS 2023
- Neighborhood character
- Predominantly White (70%)
- Race & ethnicity
- White 70% Hispanic / Latino 15% Asian 9% Two or more races 9% Black 2%
- Hispanic origin (detail)
- Mexican 3% Puerto Rican 4% Dominican 1%
- Common ancestry
- Romanian 4% Scotch-Irish 3% Iranian 2%
- Foreign-born
- 21% · Canada, Jamaica, Vietnam
- Languages at home
- 76% English-only · Spanish 10% Other Indo-European 5% Vietnamese 3%
Political lean MEDSL · Atlantic
- 2024 margin
- Toss-up / Even · D 47.7% · R 50.7% · Other 1.6%
- 2008→2024 swing
- -18.1pp toward R · 2008: 15.1pp · 2024: -3.0pp
- All cycles
- 2024: R+3.0 2020: D+6.7 2016: D+6.2 2012: D+17.2 2008: D+15.1
Not yet ingested
- Civics
- —
Market trends
- HPI YoY
- ▼ -223.99%
- Current HPI
- 449.3494
- Rent YoY
- ▲ 57.28%
- Metro
- Atlantic City-Hammonton, NJ
- State GDP YoY
- ▲ 2.05%
- F500 in state
- 34
Industry mix (Fortune 500 HQ in NJ)
| Industry | F500 HQs | Revenue |
|---|---|---|
| Consumer Goods | 3 | $31B |
|
||
| Pharmaceuticals | 2 | $153B |
|
||
| Technology | 2 | $21B |
|
||
| Insurance | 2 | $20B |
|
||
| Healthcare | 2 | $19B |
|
||
| Financial Services | 1 | $70B |
|
||
Price history
+415.2% since first listed3 events — show timeline
- 2026-05-21 Contingent — SJSRMLS
- 2026-05-11 Listed $850,000 SJSRMLS
- 1994-10-03 Sold (Public Records) $165,000 Public Records
Property tax history
+2.3%/yrLatest (2025): $8,725 · +3.4% YoY. Source: county tax records.
Cash-flow waterfall
monthlySold comps — $/sqft
last 12 mo · ≤1 miLoading sold comps…