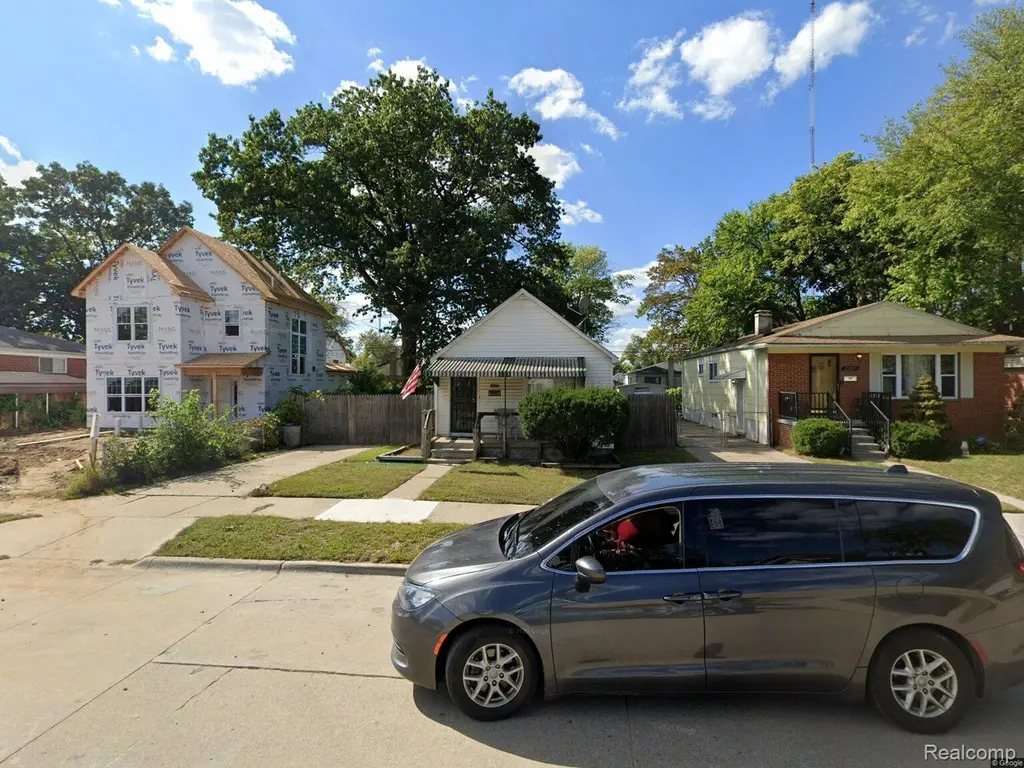
21385 Garden Ln
Royal Oak, MI 48220
$110,000B
2 bd · 1.0 ba ·
1,023 sqft ·
Built 1941
· SingleFamily
· Active
· 27 DOM
Cashflow @ list (25.0% down · 7.5%)
Estimated rent
$1,591/mo
Mortgage (P&I)
−$577
Tax + insurance
−$223
HOA
−$0
Vac / Maint / Mgmt
−$334
Net cashflow
$457/mo
Annual
$5,483/yr
Cap rate
11.28%
Cash-on-cash
17.80%
DSCR
1.79
1% rule
1.45%
Cash to close
$30,800
Investor read
- This is a 2-bed/1.0-bath single-family listed at $110k.
- At list price, monthly cash flow is $457 ($5k/yr) — positive.
- The deal already cash-flows at list — no discount required.
- Meets the 1% rule at list price ($2k rent vs $110k).
- It's been on market 27 days — a 2% lower offer ($108k) is reasonable based on typical stale-listing flexibility.
- Recommended offer: $108k (1.5% below list) — sets the bar for market timing.
- Local home prices are declining (-3.0%/yr); year-one equity from $761 of loan paydown is wiped out by about $3k of value loss. Plan a longer hold.
- Location reads 83/100 on livability (#50 in MI, #1,020 nationally) — a professional / high-income tenant draw. Strengths: crime A+, commute A+, employment A+; Watch: amenities D+.
- Ferndale Public Schools (suburban): math 18% / reading 39% proficiency, ranked #366 of 540 in MI (top 68%) — low school quality limits family demand, transient renter base, plan for 1-2y turnover.
- Watch-outs: built in 1941 — expect roof / HVAC / electrical / plumbing capex.
- Market conditions: Rents rising fast (+6.2%/yr); 171 active listings in the ZIP; 40 comparable units currently listed for rent nearby; rentals at typical pace (median 21d on market — plan ~3-4 weeks tenant-placement turnaround); solid renter incomes; 2,614 units permitted in Oakland County in 2024 (721 in 5+ unit buildings).
- Oakland County population projected at +10% by 2050 — modest demand growth; plan on rents tracking national, not racing it.
- 4 sale attempts since 19y ago with the ask held roughly flat each time — persistent listings suggest the price (not the market) is what's stuck; bring a comps-based counter.
- Current owner paid $14k; list at $110k implies a 659% gain — meaningful room to come down on a strong offer.
- At projected returns (-3.0% appreciation + 6.2% rent growth), your $31k cash investment doubles in ~6 years — after that, you're playing with house money.
- Cap rate 11.3% vs local median 3.8% in Royal Oak — top-decile yield for the area; either an underpriced asset or a hidden risk that comps aren't pricing in. Stress-test before assuming the spread holds.
Questions for listing agent
- Built in 1941 — when were the roof, HVAC, electrical panel, plumbing, and water heater last replaced?
- Is there a deadline driving the sale (1031 exchange, divorce, estate, relocation)? That informs how much negotiation room exists.
- Schools are B-rated — typically a magnet for longer-tenancy family renters. What's the average tenant stay here, and is there a school-zone premium baked into asking?
- What's the average days-on-market for RENTAL listings here right now (not sales)? A rising rental-DOM trend means longer vacancies and softer asking-rent achievability than the comps imply.
- What's the recent tenant-quality profile in this submarket — average credit score on applications, eviction rate, late-payment / NSF rate, and stable-employment percentage? A property-management company in the area should have these aggregated.
- How much new for-sale + rental construction is in the pipeline within 1–3 miles? Heavy new supply typically softens prices + rents 12–24 months out; constrained supply supports both.
CashFlowRE · CFR-P9G4F1AJ3W9EM3
· Data 1 day ago
cashflowre.app · 2026-05-29