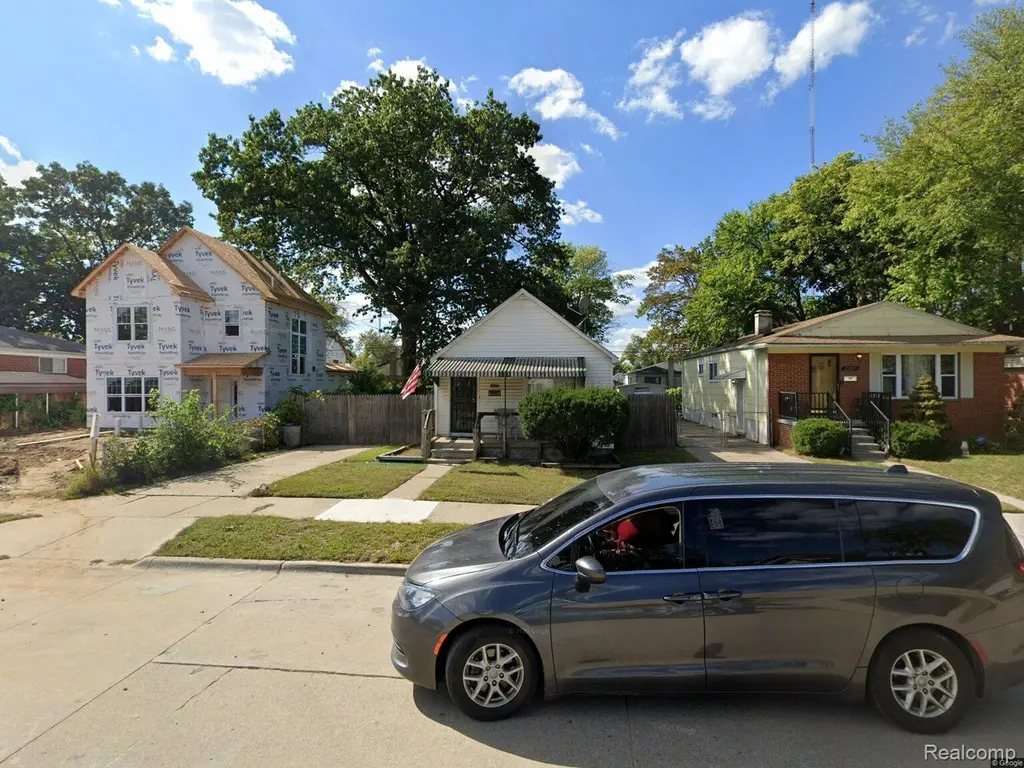
21385 Garden Ln · Royal Oak, MI
Flood risk 4/10 · Minor
- FEMA flood zone
- X (unshaded)
- Chance of flooding over 30 yrs
- 0.22%
- Est. flood insurance / yr
- $473 – $860
Fire risk 1/10 · Minimal
- Est. fire insurance / yr
- $784 – $1,456
Heat risk 3/10 · Minor
- Hot days now (above 97°F)
- 7 days/yr
- Hot days in 30 yrs
- 15 days/yr
Wind risk 2/10 · Minimal
- Chance of severe wind over 30 yrs
- —
Air-quality risk 4/10 · Minor
- Unhealthy air days now
- 3 days/yr
- Unhealthy air days in 30 yrs
- 6 days/yr
Risk factors via First Street. Map © Google.
Why this score? — see what drove the B grade
The composite is a weighted blend of 9 inputs, each scored 0–100. Each bar is that input's sub-score; the figure is the points it added to the 100-point composite (weight × sub-score).
- Cash flow +30.0/30.0
- DSCR +10.0/10.0
- 1% rule +9.5/10.0
- ARV discount +7.5/15.0
- Livability +4.2/5.0
- Rent growth +4.1/5.0
- Schools +2.5/10.0
- Condition / age +2.5/5.0
- Appreciation +0.0/10.0
$110,000
🖨 Deal sheet 📄 Offer letter ✓ Due diligence
Listing remarks MLS
Great home ready for new owner to renovate.
Key facts
- 4,356 sq ft lot
- Built 1941
- Listed 27 days
Property features AI
Finance
- Other: Subdivision: FOREST GROVENO 1; Directions: 8 Mile to Garden Lane (cross street: 8 Mile and Garden Lane)
Exterior
- Parking: No garage
- Utilities: Water available; Sewer available
- Home design: Single-family residence; One-story home with ground-level entry; Vinyl siding
- Construction: Built on a slab foundation
- Exterior features: Paved road access; Lot approximately 0.1 acre (45 x 102)
Interior
- Bathrooms: One full bathroom
- Heating & cooling: Natural gas heating; ENERGY STAR qualified equipment; No central cooling
- Interior features: Three total rooms
Neighborhood map
What this means for you Summary
Snapshot
- This is a 2-bed/1.0-bath single-family listed at $110k.
Deal economics
- At list price, monthly cash flow is $457 ($5k/yr) — positive.
- The deal already cash-flows at list — no discount required.
- Meets the 1% rule at list price ($2k rent vs $110k).
- Recommended offer: $108k (1.5% below list) — sets the bar for market timing.
- Cap rate 11.3% vs local median 3.8% in Royal Oak — top-decile yield for the area; either an underpriced asset or a hidden risk that comps aren't pricing in. Stress-test before assuming the spread holds.
Location & tenants
- Location reads 83/100 on livability (#50 in MI, #1,020 nationally) — a professional / high-income tenant draw. Strengths: crime A+, commute A+, employment A+; Watch: amenities D+.
- Ferndale Public Schools (suburban): math 18% / reading 39% proficiency, ranked #366 of 540 in MI (top 68%) — low school quality limits family demand, transient renter base, plan for 1-2y turnover.
- Market conditions: Rents rising fast (+6.2%/yr); 171 active listings in the ZIP; 40 comparable units currently listed for rent nearby; rentals at typical pace (median 21d on market — plan ~3-4 weeks tenant-placement turnaround); solid renter incomes; 2,614 units permitted in Oakland County in 2024 (721 in 5+ unit buildings).
Forward outlook
- Local home prices are declining (-3.0%/yr); year-one equity from $761 of loan paydown is wiped out by about $3k of value loss. Plan a longer hold.
- Oakland County population projected at +10% by 2050 — modest demand growth; plan on rents tracking national, not racing it.
- At projected returns (-3.0% appreciation + 6.2% rent growth), your $31k cash investment doubles in ~6 years — after that, you're playing with house money.
Negotiation context
- It's been on market 27 days — a 2% lower offer ($108k) is reasonable based on typical stale-listing flexibility.
- 4 sale attempts since 19y ago with the ask held roughly flat each time — persistent listings suggest the price (not the market) is what's stuck; bring a comps-based counter.
- Current owner paid $14k; list at $110k implies a 659% gain — meaningful room to come down on a strong offer.
Risks & watch-outs
- Watch-outs: built in 1941 — expect roof / HVAC / electrical / plumbing capex.
Questions for the listing agent
- Built in 1941 — when were the roof, HVAC, electrical panel, plumbing, and water heater last replaced?
- Is there a deadline driving the sale (1031 exchange, divorce, estate, relocation)? That informs how much negotiation room exists.
- Schools are B-rated — typically a magnet for longer-tenancy family renters. What's the average tenant stay here, and is there a school-zone premium baked into asking?
- What's the average days-on-market for RENTAL listings here right now (not sales)? A rising rental-DOM trend means longer vacancies and softer asking-rent achievability than the comps imply.
- What's the recent tenant-quality profile in this submarket — average credit score on applications, eviction rate, late-payment / NSF rate, and stable-employment percentage? A property-management company in the area should have these aggregated.
- How much new for-sale + rental construction is in the pipeline within 1–3 miles? Heavy new supply typically softens prices + rents 12–24 months out; constrained supply supports both.
Investment metrics
- 1% rule
- 1.45% ✓
- Cap rate
- 11.28%
- Cash-on-cash
- 17.80%
- DSCR
- 1.79
- GRM
- 5.8
CMA / ARV
- ARV (on-the-fly)
- $242,451
- Comps found
- 12
Show comp detail 12 sales within ~0.75 mi
| Address | Dist | Beds/Ba | Sqft | Sold | Price | $/sf | Match |
|---|---|---|---|---|---|---|---|
| 21395 Westview Ave | 0.10mi | 3/1.0 (+1) | 1,100 (+8%) | 3mo | $125,000 | $114 | 76 |
| 10311 Saratoga St | 0.57mi | 2/1.0 | 1,029 (+1%) | 0mo | $139,000 | $135 | 72 |
| 8796 Saratoga St | 0.47mi | 3/1.0 (+1) | 985 (-4%) | 0mo | $233,000 | $237 | 66 |
| 1368 Northway St | 0.67mi | 3/1.0 (+1) | 1,017 (-1%) | 0mo | $264,900 | $260 | 62 |
| 20805 Bethlawn Blvd | 0.41mi | 3/1.5 (+1) | 1,083 (+6%) | 3mo | $168,500 | $156 | 62 |
| 8570 Troy St | 0.52mi | 3/1.5 (+1) | 969 (-5%) | 1mo | $260,000 | $268 | 59 |
| 10280 Troy St | 0.64mi | 3/1.0 (+1) | 988 (-3%) | 1mo | $180,000 | $182 | 58 |
| 10731 Albany St | 0.66mi | 3/1.0 (+1) | 972 (-5%) | 2mo | $159,000 | $164 | 54 |
| 23241 Republic Ave | 0.75mi | 3/1.0 (+1) | 1,057 (+3%) | 3mo | $211,150 | $200 | 52 |
| 1169 W Marshall St | 0.53mi | 3/1.0 (+1) | 909 (-11%) | 1mo | $216,000 | $238 | 51 |
| 1028 W Hazelhurst St | 0.72mi | 3/1.0 (+1) | 1,087 (+6%) | 2mo | $326,400 | $300 | 49 |
| 23066 Ithaca St | 0.67mi | 3/2.0 (+1) | 932 (-9%) | 3mo | $230,000 | $247 | 42 |
Match score weights: distance 35% · size 25% · config 20% · recency 20%. Top-matched comps best support the ARV.
Projected returns pro-forma
-3.0% appreciation · 6.24% rent growth · sell at horizon
- IRR
- 13.1%
- Equity multiple
- 1.54×
- Total profit
- $16,680
- Equity at exit
- $16,401
- IRR
- 24.4%
- Equity multiple
- 3.46×
- Total profit
- $75,683
- Equity at exit
- $9,511
Cash invested: $30,800 (down + closing). Projections, not guarantees.
Landlord ↔ Tenant lean methodology
- Overall (STATE)
- 62 Landlord-Friendly
- State Michigan
- 62 Landlord-Friendly · EVEN
- County
- — inherits STATE
- City
- — inherits STATE
ZIP-level market 48220
- Rents YoY
- 6.2%
- Active inventory
- 171
- Price-to-rent
- 5.8×
Monthly cashflow live
- Estimated rent
- $1,591 high interval (Pro) →
- Mortgage (P&I)
- −$577
- Tax from tax record
- −$177 /mo · $2,129/yr
- Insurance
- −$46
- HOA
- −$0
- Vacancy / Maint / Mgmt
- −$334
- Net cashflow
- $457
Break-even live
UW: 25.0% down · 7.5% · 30yr · 1.5% tax · 5.0% vac · 8.0% maint · 8.0% mgmt
Financing live
Cash to close
- Down payment
- $27,500
- Closing costs
- $3,300
- Reserves months
- —
- Total cash needed
- —
Loan-product check · same deal, 3 products live
Conventional
25% down · 7.5% · 30yr
- Down + closing
- —
- Monthly P&I
- —
- Monthly cashflow
- —
- DSCR
- —
- Eligible?
- —
Personal DTI + credit; lowest rate.
DSCR
20% down · 8.5% · 30yr
- Down + closing
- —
- Monthly P&I
- —
- Monthly cashflow
- —
- DSCR
- —
- Eligible?
- —
No personal income docs; deal must DSCR.
Hard money
10% down · 12.0% · 12mo
- Down + closing
- —
- Monthly P&I
- —
- Monthly cashflow
- —
- DSCR
- —
- Eligible?
- —
Short-term bridge; refi at stabilization.
Rent comps 40 comps
| Address | Beds | Baths | Sqft | Rent | $/sqft | DOM | Units | Dist |
|---|---|---|---|---|---|---|---|---|
| 21374 Ithaca Ave Ferndale, MI | 3.0 | 1.0 | 996 | $1,775 | $1.78 | 24d | 1 | 0.19mi |
| 1557 Leroy St Ferndale, MI | 3.0 | 2.0 | 1380 | $2,523 | $1.83 | 5d | 1 | 0.42mi |
| 22811 Rosewood St Oak Park, MI | 3.0 | 1.0 | 1000 | $1,600 | $1.60 | 24d | 1 | 0.48mi |
| 10020 Corning St Oak Park, MI | 2.0 | 1.0 | 829 | $1,400 | $1.69 | 24d | 1 | 0.54mi |
| 20458 Indiana St Detroit, MI | 3.0 | 1.0 | 1049 | $1,300 | $1.24 | 18d | 1 | 0.54mi |
| 20515 Ilene St Detroit, MI | 3.0 | 1.0 | 891 | $1,450 | $1.63 | 44d | 1 | 0.55mi |
| 20445 Kentucky St Detroit, MI | 3.0 | 1.0 | 1046 | $1,200 | $1.15 | 24d | 1 | 0.56mi |
| 1491 W Nine Mile Rd Unit 9 Ferndale, MI | 2.0 | 1.0 | 900 | $1,350 | $1.50 | 44d | 1 | 0.59mi |
| 10000 W Nine Mile Rd Unit 3 Oak Park, MI | 2.0 | 1.0 | 900 | $1,000 | $1.11 | 44d | 1 | 0.61mi |
| 20460 Griggs St Detroit, MI | 2.0 | 1.0 | 910 | $1,100 | $1.21 | 17d | 1 | 0.61mi |
| 10050 W Nine Mile Rd Unit 18 Oak Park, MI | 2.0 | 1.0 | 900 | $1,000 | $1.11 | 5d | 1 | 0.61mi |
| 10400 Saratoga St Oak Park, MI | 2.0 | 1.0 | 829 | $1,450 | $1.75 | 5d | 1 | 0.61mi |
| 631 Shasta Pl Ferndale, MI | 3.0 | 2.0 | 1317 | $2,100 | $1.59 | 44d | 1 | 0.64mi |
| 20185 Indiana St Detroit, MI | 2.0 | 1.5 | 1096 | $1,275 | $1.16 | 44d | 1 | 0.67mi |
| 1260 W Nine Mile Rd Unit 13 Ferndale, MI | 2.0 | 1.0 | 1000 | $1,399 | $1.40 | 15d | 1 | 0.72mi |
| 578 Kensington Ave Ferndale, MI | 2.0 | 1.0 | 860 | $1,600 | $1.86 | 5d | 1 | 0.73mi |
| 20110 Northlawn St Detroit, MI | 3.0 | 1.0 | 1100 | $1,350 | $1.23 | 17d | 1 | 0.77mi |
| 20429 Monte Vista St Detroit, MI | 3.0 | 1.0 | 872 | $1,300 | $1.49 | 17d | 1 | 0.78mi |
| 510 Stratford Rd Ferndale, MI | 2.0 | 1.0 | 965 | $1,750 | $1.81 | 44d | 1 | 0.80mi |
| 20009 Wisconsin St Detroit, MI | 3.0 | 1.5 | 1051 | $1,400 | $1.33 | 17d | 1 | 0.82mi |
| 695 Livernois St Unit 3 Ferndale, MI | 1.0 | 1.0 | 830 | $2,150 | $2.59 | 13d | 1 | 0.82mi |
| 695 Livernois St Unit 2 Ferndale, MI | 2.0 | 1.0 | 950 | $2,350 | $2.47 | 4d | 1 | 0.82mi |
| 695 Livernois St Unit 1 Ferndale, MI | 2.0 | 2.0 | 1500 | $2,750 | $1.83 | 13d | 1 | 0.82mi |
| 20045 Greenlawn St Detroit, MI | 3.0 | 1.0 | 925 | $1,350 | $1.46 | 44d | 1 | 0.85mi |
| 20245 Manor Detroit, MI | 3.0 | 1.0 | 1018 | $1,400 | $1.38 | 3d | 1 | 0.86mi |
| 20122 Manor St Detroit, MI | 3.0 | 1.0 | 1028 | $1,200 | $1.17 | 44d | 1 | 0.93mi |
| 23511 Majestic St Oak Park, MI | 3.0 | 1.0 | 1100 | $1,750 | $1.59 | 24d | 1 | 0.94mi |
| 20032 Monte Vista St Detroit, MI | 3.0 | 1.0 | 1000 | $1,294 | $1.29 | 20d | 1 | 0.94mi |
| 12800 W 9 Mile Rd Oak Park, MI | 1.0–2.0 | 1.0 | 775 | $1,250 | $1.61 | 24d | 1 | 0.96mi |
| 851 Gardendale St Ferndale, MI | 2.0 | 1.0 | 933 | $1,625 | $1.74 | 24d | 1 | 0.98mi |
| 19929 Monte Vista St Detroit, MI | 3.0 | 1.0 | 860 | $1,450 | $1.69 | 17d | 1 | 1.04mi |
| 20038 Santa Rosa Dr Detroit, MI | 3.0 | 1.0 | 927 | $1,300 | $1.40 | 17d | 1 | 1.10mi |
| 22148 Dante St #212 Oak Park, MI | 2.0 | 2.0 | 916 | $1,475 | $1.61 | 22d | 1 | 1.10mi |
| 22148 Dante St #211 Oak Park, MI | 2.0 | 1.0 | 916 | $1,475 | $1.61 | 24d | 1 | 1.10mi |
| 22148 Dante St #211 Oak Park, MI | 2.0 | 2.0 | 916 | $1,475 | $1.61 | 18d | 1 | 1.10mi |
| 22108 Dante St #115 Oak Park, MI | 2.0 | 2.0 | 898 | $1,250 | $1.39 | 24d | 1 | 1.12mi |
| 22108 Dante St Oak Park, MI | 2.0 | 1.0 | 898 | $1,250 | $1.39 | 24d | 1 | 1.14mi |
| 413 W Nine Mile Rd Ste B Ferndale, MI | 1.0 | 1.0 | 897 | $1,850 | $2.06 | 18d | 1 | 1.15mi |
| 415 W Nine Mile Rd Ferndale, MI | 1.0 | 1.0 | 912 | $2,500 | $2.74 | 18d | 1 | 1.15mi |
| 430 W 9 Mile Rd Ferndale, MI | 1.0–2.0 | 1.0–2.0 | 754 | $2,827 | $3.75 | 2d | 3 | 1.16mi |
Listing history 21 events
-
2026-06-18days on market $110,000 Active 27 DOM
-
2026-06-17days on market $110,000 Active 26 DOM
-
2026-06-16days on market $110,000 Active 25 DOM
-
2026-06-15days on market $110,000 Active 24 DOM
-
2026-06-13days on market $110,000 Active 22 DOM
-
2026-06-13days on market $110,000 Active 21 DOM
-
2026-06-09days on market $110,000 Active 18 DOM
-
2026-06-08days on market $110,000 Active 17 DOM
-
2026-06-07days on market $110,000 Active 16 DOM
-
2026-06-04days on market $110,000 Active 13 DOM
-
2026-06-03days on market $110,000 Active 12 DOM
-
2026-06-02days on market $110,000 Active 11 DOM
-
2026-06-01days on market $110,000 Active 10 DOM
-
2026-05-31days on market $110,000 Active 9 DOM
-
2026-05-22$110,000 Active
Show marketing remark (43 chars)
Great home ready for new owner to renovate.
-
2026-05-22$110,000 Active 43-char remark
Show marketing remark (43 chars)
Great home ready for new owner to renovate.
-
2009-10-08historical
-
2009-10-07$5,900
-
2008-02-22historical
-
2007-12-28$9,900
-
1986-07-01soldstatus $14,500
ⓘ Source: listings_history table (triggers on properties + properties_extension) + one-shot
backfill from property_details.listing_events for pre-trigger history.
Tax reassessment forecast MI · Partial reset (capped growth)
- Current annual tax
- $2,129 · $177/mo
- Projected year-2 tax
- $2,129 · $177/mo
- Expected delta
- $0/yr ($0/mo · 0.0%)
ⓘ Screening estimate from a state-policy table — verify with the county assessor before closing.
Climate risk First Street
- Flood 4/10 Moderate FEMA zone X (unshaded) · 22% chance over 30 yrs
- Wildfire 1/10 Low
- Heat 3/10 Moderate 7 d/yr ≥97°F today · 15 d/yr by 30 yrs out
- Wind 2/10 Low
- Air quality 4/10 Moderate 3 unhealthy d/yr today · 6 by 30 yrs out
Nearby sold comps map
Loading sold comps map…
Walkable amenities ~0.75 mi
Loading nearby amenities…
Taxation est. · year 1
- Rental income
- $19,094
- − Mortgage interest
- −$6,162
- − Property taxes
- −$2,129
- − Insurance
- −$550
- − Repairs & maintenance
- −$1,528
- − Management
- −$1,528
- − Depreciation
- −$3,200
- Taxable income
- $3,998
- Est. tax owed @ 24.0%
- −$960
- After-tax cash flow
- $4,523/yr
For passive investors: Depreciation is non-cash, so a rental often shows a tax loss while cash-flowing — sheltering income. Rental losses are passive: they offset passive income freely, and up to $25,000/yr can offset ordinary (W-2) income if you actively participate and your MAGI is under $100k (phasing out to $0 by $150k); unused losses carry forward. On sale, claimed depreciation is recaptured at up to 25%, and gains may owe capital-gains tax (a 1031 exchange can defer both). Figures are a year-1 estimate at your 24.0% rate — not tax advice; consult a CPA.
Schools (NCES district)
- District
- Ferndale Public Schools
- NCES district ID
- 2614280
- Math proficiency
- 18% ▼ -3.00%
- Reading proficiency
- 39% ▲ 5.00%
- Median HH income
- $56,069
- Composite
- 25.46/100
- National rank
- #7449
- State rank
- #366 of 540 in MI
Livability — Royal Oak
- Score
- 83/100
- State rank
- #50
- US rank
- #1020
Category grades
Schools grade is shown separately in the Schools card above.
Census & demographics
- County
- Oakland County · 1,009,092 people
- City population
- 57,974
- Metro
- Detroit-Warren-Dearborn, MI
- Population (ZIP)
- 21,527
- Household income
- $89,881
- Rent vs Own
- Severe rent burden
- 670.0
Population outlook (Oakland County) Hauer SSP2
- Today (2025)
- 1,335,747 people
- By 2030
- 1,375,100 · +2.9%
- By 2040
- 1,435,385 · +7.5%
- By 2050
- 1,469,250 · +10.0%
- By 2075
- 1,531,946 · +14.7%
- By 2100
- 1,450,485 · +8.6%
Race, ethnicity, and origin ACS 2023
- Neighborhood character
- Predominantly White (72%)
- Race & ethnicity
- White 72% Black 15% Two or more races 6% Hispanic / Latino 5% Asian 3%
- Common ancestry
- Romanian 11% Lithuanian 6% Slovak 3%
- Foreign-born
- 4% · Canada, South Korea
- Languages at home
- 95% English-only · Spanish 2% Other Indo-European 1% German/W. Germanic 1%
Political lean MEDSL · Oakland
- 2024 margin
- D (+10.6) · D 54.4% · R 43.8% · Other 1.9%
- 2008→2024 swing
- -3.9pp toward R · 2008: 14.5pp · 2024: 10.6pp
- All cycles
- 2024: D+10.6 2020: D+14.1 2016: D+8.1 2012: D+8.1 2008: D+14.5
Not yet ingested
- Civics
- —
Market trends
- HPI YoY
- ▼ -394.92%
- Current HPI
- 273.0986
- Rent YoY
- ▲ 6.24%
- Metro
- Detroit-Warren-Dearborn, MI
- State GDP YoY
- ▲ 1.37%
- F500 in state
- 28
Industry mix (Fortune 500 HQ in MI)
| Industry | F500 HQs | Revenue |
|---|---|---|
| Automotive Parts | 3 | $48B |
|
||
| Automotive | 2 | $372B |
|
||
| Chemicals | 1 | $45B |
|
||
| Automotive Retail | 1 | $29B |
|
||
| Healthcare / Medical Devices | 1 | $23B |
|
||
| Automotive Technology | 1 | $20B |
|
||
Price history
+658.6% since first listed7 events — show timeline
- 2026-05-22 Listed $110,000 MiRealSource-MiMLS
- 2026-05-22 Listed $110,000 REALCOMP
- 2009-10-08 Listing Removed — REALCOMP
- 2009-10-07 Listed $5,900 REALCOMP
- 2008-02-22 Listing Removed — REALCOMP
- 2007-12-28 Listed $9,900 REALCOMP
- 1986-07-01 Sold (Public Records) $14,500 Public Records
Property tax history
+1.5%/yrLatest (2025): $2,129 · +71.4% YoY. Source: county tax records.
Cash-flow waterfall
monthlySold comps — $/sqft
last 12 mo · ≤1 miLoading sold comps…