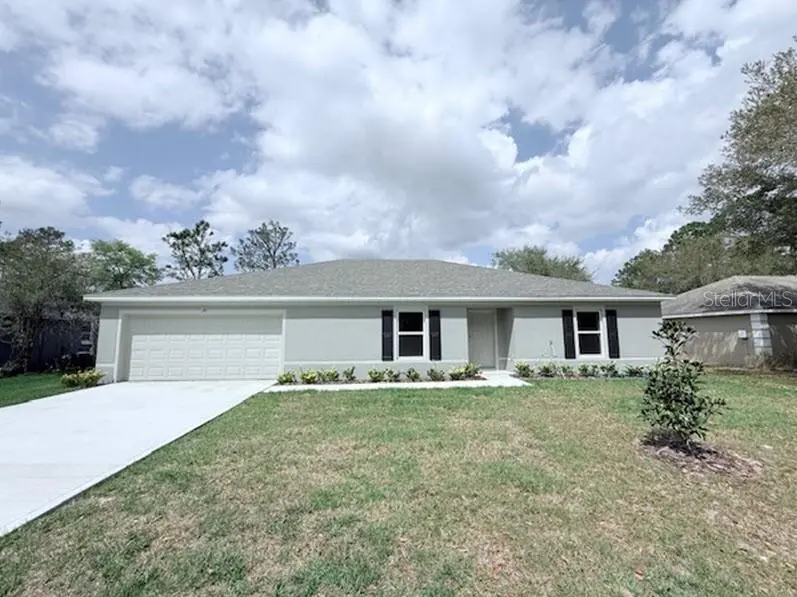
39 Slipper Trl
Palm Coast, FL 32164
$339,990D+
4 bd · 2.0 ba ·
2,134 sqft ·
Built 2026
· SingleFamily
· Pending
· 56 DOM
Cashflow @ list (25.0% down · 7.5%)
Estimated rent
$2,479/mo
Mortgage (P&I)
−$1,783
Tax + insurance
−$287
HOA
−$0
Vac / Maint / Mgmt
−$521
Net cashflow
$-112/mo
Annual
$-1,341/yr
Cap rate
6.13%
Cash-on-cash
-0.57%
DSCR
0.97
1% rule
0.73%
Cash to close
$95,197
Investor read
- This is a 4-bed/2.0-bath single-family listed at $340k.
- At list price, monthly cash flow is $-112 ($-1k/yr) — negative.
- To cash-flow at today's rent, offer at most $320k (5.8% below list).
- To meet the 1% rule (rent ≥ 1% of price), the offer needs to be $248k (27.1% below list).
- It's been on market 56 days — a 3% lower offer ($330k) is reasonable based on typical stale-listing flexibility.
- Recommended offer: $248k (27.1% below list) — sets the bar for 1% rule.
- Local home prices are declining (-3.0%/yr); year-one equity from $2k of loan paydown is wiped out by about $10k of value loss. Plan a longer hold.
- Location reads 69/100 on livability (#478 in FL) — a middle-class / working-renter tenant base. Strengths: housing A+, health & safety A+, cost of living B+; Watch: amenities F, commute F.
- Flagler (rural): math 53% / reading 56% proficiency, ranked #20 of 73 in FL (top 27%) — acceptable for families but not a draw, mixed tenant base, ~2y average lease.
- Watch-outs: flood insurance adds $66/mo.
- Market conditions: Rents rising (+1.2%/yr); 1367 active listings in the ZIP; 11 comparable units currently listed for rent nearby; rentals at typical pace (median 24d on market — plan ~3-4 weeks tenant-placement turnaround); solid renter incomes; 2,588 units permitted in Flagler County in 2024 (0 in 5+ unit buildings).
- Flagler County population projected at +28% by 2050 — long-run rental-demand tailwind backs the buy-and-hold thesis.
- Current owner paid $68k; list at $340k implies a 400% gain — meaningful room to come down on a strong offer.
- Climate carrying-cost: severe flood risk; severe wind risk, 99% chance of damaging wind over 30y; major wildfire risk — expect insurance premiums to compound above CPI over the hold.
- Cap rate 6.1% vs local median 3.8% in Palm Coast — top-decile yield for the area; either an underpriced asset or a hidden risk that comps aren't pricing in. Stress-test before assuming the spread holds.
- This rent runs 39% of the median local income ($76k/yr) — at the standard rent-burdened threshold; future hikes will face affordability resistance.
Questions for listing agent
- What do current leases actually rent for vs. the listed asking? Can we see a recent rent roll and the last 12 months of T-12 income?
- It's been on market 56 days. Have you received any prior offers? Is the seller open to a 27% concession, seller financing, or rate buy-down credit?
- What's the actual annual flood-insurance premium (NFIP or private), and is the property in a SFHA with mandatory coverage?
- Is there a deadline driving the sale (1031 exchange, divorce, estate, relocation)? That informs how much negotiation room exists.
- The area grade is low — what's the realistic commute time and amenity access for the typical tenant pool here? Any planned neighborhood developments (good or bad) we should know about?
- What's the average days-on-market for RENTAL listings here right now (not sales)? A rising rental-DOM trend means longer vacancies and softer asking-rent achievability than the comps imply.
- What's the recent tenant-quality profile in this submarket — average credit score on applications, eviction rate, late-payment / NSF rate, and stable-employment percentage? A property-management company in the area should have these aggregated.
- How much new for-sale + rental construction is in the pipeline within 1–3 miles? Heavy new supply typically softens prices + rents 12–24 months out; constrained supply supports both.
CashFlowRE · CFR-P9TF6H6EEZH7SY
· Data 3 weeks ago
cashflowre.app · 2026-05-29