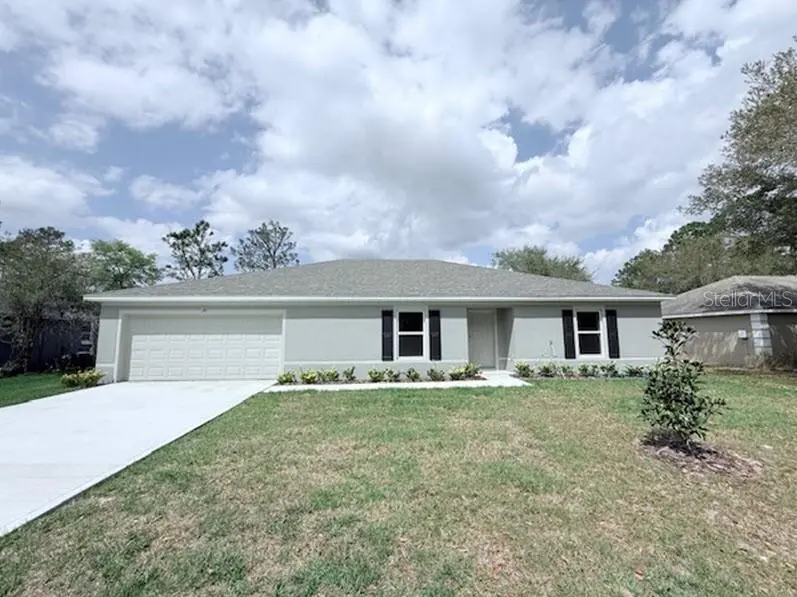
39 Slipper Trl · Palm Coast, FL
Flood risk 8/10 · Major
- FEMA flood zone
- X (unshaded)
- Chance of flooding over 30 yrs
- 0.99%
- Est. flood insurance / yr
- $507 – $1,088
Fire risk 6/10 · Moderate
- Est. fire insurance / yr
- $947 – $1,759
Heat risk No data
- Hot days now (above threshold)
- —
- Hot days in 30 yrs
- —
Wind risk 10/10 · Severe
- Chance of severe wind over 30 yrs
- 99.0%
Air-quality risk 3/10 · Minor
- Unhealthy air days now
- 2 days/yr
- Unhealthy air days in 30 yrs
- 3 days/yr
Risk factors via First Street. Map © Google.
Why this score? — see what drove the D+ grade
The composite is a weighted blend of 9 inputs, each scored 0–100. Each bar is that input's sub-score; the figure is the points it added to the 100-point composite (weight × sub-score).
- ARV discount +14.2/15.0
- Cash flow +12.6/30.0
- Schools +4.6/10.0
- DSCR +3.7/10.0
- Livability +3.5/5.0
- Rent growth +2.8/5.0
- Condition / age +2.5/5.0
- 1% rule +2.3/10.0
- Appreciation +0.0/10.0
$339,990
🖨 Deal sheet 📄 Offer letter ✓ Due diligence
Listing remarks
READY NOW!! The MAJESTIC floor plan has four bedrooms and a den, two full bathrooms, a two-car garage, and 2134 square feet of living space. An island-design kitchen overlooks the spacious Great Room, which offers plenty of room for gathering and entertaining. The den is located at the front of the home. The MAJESTIC is a split floor plan with three bedrooms on one side of the home and the owner's suite on the other side. The MAJESTIC also comes with one full year of builder's warranty coverage and a 10-year limited structural warranty. Call to learn about builder incentives.
Key facts
- 0.23 acre lot
- 2 garage spots
- Built 2026
Property features AI
Finance
- Other: Property zoned SFR-3; Living area reported by builder (2,134); Total building area reported by builder (2,572); Lot size about 0.23 acres (≈929 m²)
- Financial info: No lease restrictions indicated
- HOA & community: Deed restrictions; Pets allowed
Exterior
- Parking: Attached garage with 2 spaces
- Utilities: Public water; Public sewer; Electricity available and connected; Water available and connected
- Home design: Single family residence; One story; Completed new construction; Southeast facing
- Construction: Block and stucco construction; Shingle roof; Slab foundation; Built by Holiday Builders (model: MAJESTIC)
- Exterior features: Sliding doors; Asphalt road access; Lot approximately 0.23 acres
Interior
- Kitchen: Dishwasher; Microwave; Range; Electric water heater
- Bedrooms: 4 bedrooms
- Flooring: Carpet; Vinyl
- Bathrooms: 2 full bathrooms
- Heating & cooling: Central heating (electric); Central air conditioning
- Interior features: Open floorplan with kitchen/family room combo; Split bedroom layout; Walk-in closets; Den/Library/Office; Great Room
- Laundry & utility: Laundry room inside
Neighborhood map
What this means for you Summary
Snapshot
- This is a 4-bed/2.0-bath single-family listed at $340k.
Deal economics
- At list price, monthly cash flow is $-112 ($-1k/yr) — negative.
- To cash-flow at today's rent, offer at most $320k (5.8% below list).
- To meet the 1% rule (rent ≥ 1% of price), the offer needs to be $248k (27.1% below list).
- Recommended offer: $248k (27.1% below list) — sets the bar for 1% rule.
- Cap rate 6.1% vs local median 3.8% in Palm Coast — top-decile yield for the area; either an underpriced asset or a hidden risk that comps aren't pricing in. Stress-test before assuming the spread holds.
Location & tenants
- Location reads 69/100 on livability (#478 in FL) — a middle-class / working-renter tenant base. Strengths: housing A+, health & safety A+, cost of living B+; Watch: amenities F, commute F.
- Flagler (rural): math 53% / reading 56% proficiency, ranked #20 of 73 in FL (top 27%) — acceptable for families but not a draw, mixed tenant base, ~2y average lease.
- Market conditions: Rents rising (+1.2%/yr); 1367 active listings in the ZIP; 11 comparable units currently listed for rent nearby; rentals at typical pace (median 24d on market — plan ~3-4 weeks tenant-placement turnaround); solid renter incomes; 2,588 units permitted in Flagler County in 2024 (0 in 5+ unit buildings).
- This rent runs 39% of the median local income ($76k/yr) — at the standard rent-burdened threshold; future hikes will face affordability resistance.
Forward outlook
- Local home prices are declining (-3.0%/yr); year-one equity from $2k of loan paydown is wiped out by about $10k of value loss. Plan a longer hold.
- Flagler County population projected at +28% by 2050 — long-run rental-demand tailwind backs the buy-and-hold thesis.
Negotiation context
- It's been on market 56 days — a 3% lower offer ($330k) is reasonable based on typical stale-listing flexibility.
- Current owner paid $68k; list at $340k implies a 400% gain — meaningful room to come down on a strong offer.
Risks & watch-outs
- Watch-outs: flood insurance adds $66/mo.
- Climate carrying-cost: severe flood risk; severe wind risk, 99% chance of damaging wind over 30y; major wildfire risk — expect insurance premiums to compound above CPI over the hold.
Questions for the listing agent
- What do current leases actually rent for vs. the listed asking? Can we see a recent rent roll and the last 12 months of T-12 income?
- It's been on market 56 days. Have you received any prior offers? Is the seller open to a 27% concession, seller financing, or rate buy-down credit?
- What's the actual annual flood-insurance premium (NFIP or private), and is the property in a SFHA with mandatory coverage?
- Is there a deadline driving the sale (1031 exchange, divorce, estate, relocation)? That informs how much negotiation room exists.
- The area grade is low — what's the realistic commute time and amenity access for the typical tenant pool here? Any planned neighborhood developments (good or bad) we should know about?
- What's the average days-on-market for RENTAL listings here right now (not sales)? A rising rental-DOM trend means longer vacancies and softer asking-rent achievability than the comps imply.
- What's the recent tenant-quality profile in this submarket — average credit score on applications, eviction rate, late-payment / NSF rate, and stable-employment percentage? A property-management company in the area should have these aggregated.
- How much new for-sale + rental construction is in the pipeline within 1–3 miles? Heavy new supply typically softens prices + rents 12–24 months out; constrained supply supports both.
Investment metrics
- 1% rule
- 0.73% ✗
- Cap rate
- 6.13%
- Cash-on-cash
- -0.57%
- DSCR
- 0.97
- GRM
- 11.4
CMA / ARV
- ARV (on-the-fly)
- $399,058
- Comps found
- 12
Show comp detail 12 sales within ~0.75 mi
| Address | Dist | Beds/Ba | Sqft | Sold | Price | $/sf | Match |
|---|---|---|---|---|---|---|---|
| 13 Sea Spiral Path | 0.35mi | 4/2.0 | 2,134 (0%) | 2mo | $349,190 | $164 | 82 |
| 5 Season Pl | 0.20mi | 3/2.0 (-1) | 2,017 (-6%) | 4mo | $255,000 | $126 | 73 |
| 8 Slipper Flower Path E | 0.07mi | 5/3.0 (+1) | 1,984 (-7%) | 8mo | $325,000 | $164 | 70 |
| 36 Slumber Path | 0.34mi | 4/3.0 | 2,265 (+6%) | 1mo | $460,000 | $203 | 69 |
| 16 Sea Shark Path | 0.37mi | 3/2.0 (-1) | 2,208 (+4%) | 5mo | $424,500 | $192 | 67 |
| 14 Sea Breeze Trl | 0.67mi | 4/3.0 | 2,117 (-1%) | 2mo | $356,900 | $169 | 62 |
| 14 Sea Serpent Trl E | 0.54mi | 3/2.0 (-1) | 1,983 (-7%) | 1mo | $399,900 | $202 | 57 |
| 16 Sea Serpent Trl E | 0.55mi | 4/3.0 | 2,306 (+8%) | 1mo | $431,000 | $187 | 56 |
| 99 Sloganeer Trl | 0.46mi | 4/2.0 | 1,880 (-12%) | 9mo | $367,000 | $195 | 51 |
| 58 Slocum Path | 0.38mi | 3/2.0 (-1) | 2,447 (+15%) | 8mo | $422,000 | $172 | 46 |
| 27 Sea Breeze Trl | 0.71mi | 4/2.0 | 1,873 (-12%) | 6mo | $380,000 | $203 | 42 |
| 38 Sea Breeze Trl | 0.73mi | 3/3.0 (-1) | 2,363 (+11%) | 4mo | $375,000 | $159 | 36 |
Match score weights: distance 35% · size 25% · config 20% · recency 20%. Top-matched comps best support the ARV.
Projected returns pro-forma
-3.0% appreciation · 1.18% rent growth · sell at horizon
- IRR
- -20.5%
- Equity multiple
- 0.30×
- Total profit
- $-66,802
- Equity at exit
- $50,694
- IRR
- -17.7%
- Equity multiple
- 0.10×
- Total profit
- $-85,516
- Equity at exit
- $29,396
Cash invested: $95,197 (down + closing). Projections, not guarantees.
Landlord ↔ Tenant lean methodology
- Overall (STATE)
- 87 Strongly Landlord-Friendly
- State Florida
- 87 Strongly Landlord-Friendly · R+3
- County
- — inherits STATE
- City
- — inherits STATE
ZIP-level market 32164
- Home prices YoY
- -6.3%
- Rents YoY
- 1.2%
- Active inventory
- 1367
- Price-to-rent
- 11.4×
Monthly cashflow live
- Estimated rent
- $2,479 high interval (Pro) →
- Mortgage (P&I)
- −$1,783
- Tax from tax record
- −$79 /mo · $945/yr
- Insurance
- −$142
- Flood insurance flood zone
- −$66 /mo · $798/yr
- HOA
- −$0
- Vacancy / Maint / Mgmt
- −$521
- Net cashflow
- $-112
Break-even live
UW: 25.0% down · 7.5% · 30yr · 1.5% tax · 5.0% vac · 8.0% maint · 8.0% mgmt
Financing live
Cash to close
- Down payment
- $84,998
- Closing costs
- $10,200
- Reserves months
- —
- Total cash needed
- —
Loan-product check · same deal, 3 products live
Conventional
25% down · 7.5% · 30yr
- Down + closing
- —
- Monthly P&I
- —
- Monthly cashflow
- —
- DSCR
- —
- Eligible?
- —
Personal DTI + credit; lowest rate.
DSCR
20% down · 8.5% · 30yr
- Down + closing
- —
- Monthly P&I
- —
- Monthly cashflow
- —
- DSCR
- —
- Eligible?
- —
No personal income docs; deal must DSCR.
Hard money
10% down · 12.0% · 12mo
- Down + closing
- —
- Monthly P&I
- —
- Monthly cashflow
- —
- DSCR
- —
- Eligible?
- —
Short-term bridge; refi at stabilization.
Rent comps 11 comps
| Address | Beds | Baths | Sqft | Rent | $/sqft | DOM | Units | Dist |
|---|---|---|---|---|---|---|---|---|
| 62 Slumber Meadow Trl Unit A Palm Coast, FL | 3.0 | 2.0 | 1452 | $1,775 | $1.22 | 19d | 1 | 0.41mi |
| 1 Slate Blue Pl Unit 1546260P Palm Coast, FL | 4.0 | 3.0 | 2335 | $5,151 | $2.21 | 14d | 1 | 0.59mi |
| 3 Sea Beacon Pl Palm Coast, FL | 5.0 | 2.5 | 2900 | $2,700 | $0.93 | 23d | 1 | 0.74mi |
| 16 Seaton Valley Path Palm Coast, FL | 3.0 | 2.0 | 1835 | $1,875 | $1.02 | 14d | 1 | 0.75mi |
| 2 Slate Pl Palm Coast, FL | 3.0 | 2.0 | 1721 | $1,950 | $1.13 | 23d | 1 | 0.76mi |
| 136 Sea Trl Palm Coast, FL | 4.0 | 2.0 | 1806 | $2,200 | $1.22 | 23d | 1 | 0.95mi |
| 12 Sea Front Trl Palm Coast, FL | 4.0 | 2.0 | 1577 | $1,750 | $1.11 | 14d | 1 | 0.98mi |
| 13 Squadron Pl Unit B Palm Coast, FL | 3.0 | 2.0 | 1676 | $1,750 | $1.04 | 23d | 1 | 1.06mi |
| 26 Serbian Bellflower Trl Unit B Palm Coast, FL | 3.0 | 2.0 | 1647 | $1,600 | $0.97 | 23d | 1 | 1.06mi |
| 2 Sebastian Ct Unit B Palm Coast, FL | 3.0 | 2.0 | 2423 | $1,750 | $0.72 | 2d | 1 | 1.27mi |
| 13 Sellner Pl Palm Coast, FL | 4.0 | 2.0 | 1617 | $1,985 | $1.23 | 23d | 1 | 1.32mi |
Listing history 4 events
-
2026-05-18status Pending
-
2026-05-06price $339,990
-
2026-03-23$345,990 Active
-
2024-08-15soldstatus $68,000
ⓘ Source: listings_history table (triggers on properties + properties_extension) + one-shot
backfill from property_details.listing_events for pre-trigger history.
Tax reassessment forecast FL · Resets to sale price
- Current annual tax
- $945 · $79/mo
- Projected year-2 tax
- $2,822 · $235/mo
- Expected delta
- +$1,877/yr (+$156/mo · 198.6%)
ⓘ Screening estimate from a state-policy table — verify with the county assessor before closing.
Climate risk First Street
- Flood 8/10 Severe FEMA zone X (unshaded) · 99% chance over 30 yrs
- Wildfire 6/10 Major
- Wind 10/10 Extreme 99% chance of damaging wind over 30 yrs
- Air quality 3/10 Moderate 2 unhealthy d/yr today · 3 by 30 yrs out
Nearby sold comps map
Loading sold comps map…
Walkable amenities ~0.75 mi
Loading nearby amenities…
Taxation est. · year 1
- Rental income
- $29,743
- − Mortgage interest
- −$19,045
- − Property taxes
- −$945
- − Insurance
- −$2,497
- − Repairs & maintenance
- −$2,379
- − Management
- −$2,379
- − Depreciation
- −$9,891
- Taxable loss
- −$7,394
- Est. tax savings @ 24.0%
- +$1,774
- After-tax cash flow
- $434/yr
For passive investors: Depreciation is non-cash, so a rental often shows a tax loss while cash-flowing — sheltering income. Rental losses are passive: they offset passive income freely, and up to $25,000/yr can offset ordinary (W-2) income if you actively participate and your MAGI is under $100k (phasing out to $0 by $150k); unused losses carry forward. On sale, claimed depreciation is recaptured at up to 25%, and gains may owe capital-gains tax (a 1031 exchange can defer both). Figures are a year-1 estimate at your 24.0% rate — not tax advice; consult a CPA.
Schools (NCES district)
- District
- Flagler
- NCES district ID
- 1200540
- Math proficiency
- 53% ▼ -9.00%
- Reading proficiency
- 56% ▼ -4.00%
- Median HH income
- $48,354
- Composite
- 46.35/100
- National rank
- #2464
- State rank
- #20 of 73 in FL
Livability — Palm Coast
- Score
- 69/100
- State rank
- #478
- US rank
- #8721
Category grades
Schools grade is shown separately in the Schools card above.
Census & demographics
- Census place
- Palm Coast, FL
- County
- Flagler County · 113,412 people
- City population
- 105,049
- Metro
- Deltona-Daytona Beach-Ormond Beach, FL
- Population (ZIP)
- 56,658
- Household income
- $76,399
- Rent vs Own
- Severe rent burden
- 1291.0
Population outlook (Flagler County) Hauer SSP2
- Today (2025)
- 123,474 people
- By 2030
- 131,864 · +6.8%
- By 2040
- 146,176 · +18.4%
- By 2050
- 157,398 · +27.5%
- By 2075
- 177,990 · +44.2%
- By 2100
- 183,381 · +48.5%
Race, ethnicity, and origin ACS 2023
- Neighborhood character
- Predominantly White (65%)
- Race & ethnicity
- White 65% Hispanic / Latino 14% Black 13% Two or more races 8% Asian 2%
- Hispanic origin (detail)
- Mexican 4% Puerto Rican 4% Cuban 2%
- Common ancestry
- Romanian 3% Russian 2% Slovak 2%
- Foreign-born
- 16% · Canada, Jamaica
- Languages at home
- 81% English-only · Spanish 9% Russian/Polish/Slavic 3% Other Indo-European 3%
Political lean MEDSL · Flagler
- 2024 margin
- Strong R (+28.2) · D 35.6% · R 63.8%
- 2008→2024 swing
- -29.8pp toward R · 2008: 1.6pp · 2024: -28.2pp
- All cycles
- 2024: R+28.2 2020: R+20.8 2016: R+20.6 2012: R+7.4 2008: D+1.6
Not yet ingested
- Civics
- —
Market trends
- HPI YoY
- ▼ -19.89%
- Current HPI
- 297.4942
- Rent YoY
- ▲ 1.18%
- Metro
- Deltona-Daytona Beach-Ormond Beach, FL
- State GDP YoY
- ▲ 3.28%
- F500 in state
- 36
Industry mix (Fortune 500 HQ in FL)
| Industry | F500 HQs | Revenue |
|---|---|---|
| Industrial Technology | 2 | $29B |
|
||
| Insurance | 2 | $17B |
|
||
| Retail | 1 | $60B |
|
||
| Technology Distribution | 1 | $58B |
|
||
| Homebuilding | 1 | $35B |
|
||
| Technology Manufacturing | 1 | $35B |
|
||
Price history
+400.0% since first listed4 events — show timeline
- 2026-05-18 Pending — Stellar MLS as Distributed by MLS Grid
- 2026-05-06 Price Changed $339,990 Stellar MLS as Distributed by MLS Grid
- 2026-03-23 Listed $345,990 Stellar MLS as Distributed by MLS Grid
- 2024-08-15 Sold (Public Records) $68,000 Public Records
Property tax history
+19.0%/yrLatest (2025): $945 · +111.4% YoY. Source: county tax records.
Cash-flow waterfall
monthlySold comps — $/sqft
last 12 mo · ≤1 miLoading sold comps…