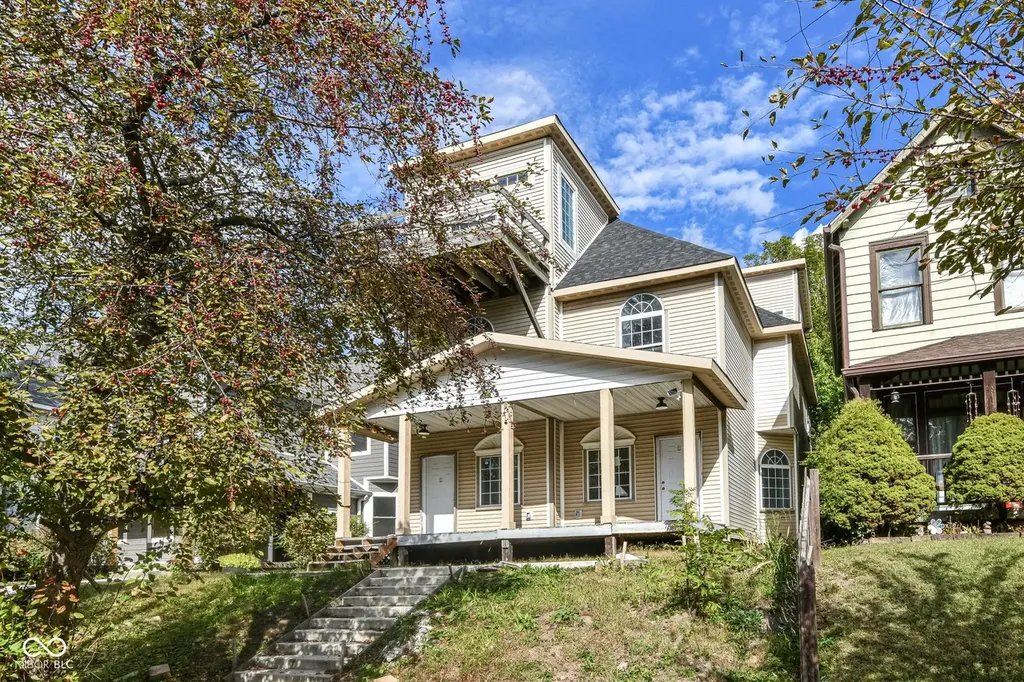
1213 N Newman St
Indianapolis city (balance), IN 46201
$525,000D+
1 bd · 24.0 ba ·
2,085 sqft ·
Built 1926
· MultiFamily
· Active
· 8 DOM
Cashflow @ list (25.0% down · 7.5%)
Estimated rent
$5,335/mo
Mortgage (P&I)
−$2,753
Tax + insurance
−$885
HOA
−$0
Vac / Maint / Mgmt
−$1,120
Net cashflow
$576/mo
Annual
$6,914/yr
Cap rate
7.61%
Cash-on-cash
4.70%
DSCR
1.21
1% rule
1.02%
Cash to close
$147,000
Investor read
- This is a 2×3bd/2ba + 2×1bd/1ba units multifamily listed at $525k.
- At list price, monthly cash flow is $576 ($7k/yr) — positive. Per door: $144/mo.
- The deal already cash-flows at list — no discount required.
- Meets the 1% rule at list price ($5k rent vs $525k).
- Only 8 days on market — expect competitive offers; lowballing is unlikely to land.
- Local home prices are declining (-3.0%/yr); year-one equity from $4k of loan paydown is wiped out by about $16k of value loss. Plan a longer hold.
- Location reads: area grade D — affects rentability + tenant quality, not the cash-flow math above.
- Indianapolis Public Schools (urban): math 14% / reading 20% proficiency, ranked #286 of 301 in IN (top 95%) — low school quality limits family demand, transient renter base, plan for 1-2y turnover; 77% free/reduced lunch — lower-income household profile, screen leases tightly.
- Watch-outs: built in 1926 — expect roof / HVAC / electrical / plumbing capex.
- Market conditions: Rents rising fast (+7.3%/yr); 480 active listings in the ZIP; 27 comparable units currently listed for rent nearby; rentals at typical pace (median 24d on market — plan ~3-4 weeks tenant-placement turnaround); 1,906 units permitted in Marion County in 2024 (621 in 5+ unit buildings).
- Marion County population projected at +18% by 2050 — long-run rental-demand tailwind backs the buy-and-hold thesis.
- 5 sale attempts since 2y ago with the ask held roughly flat each time — persistent listings suggest the price (not the market) is what's stuck; bring a comps-based counter.
- Current owner paid $230k; list at $525k implies a 128% gain — meaningful room to come down on a strong offer.
- At projected returns (-3.0% appreciation + 7.3% rent growth), your $147k cash investment doubles in ~10 years — after that, you're playing with house money.
- Cap rate 7.6% vs local median 4.4% in Indianapolis city (balance) — top-decile yield for the area; either an underpriced asset or a hidden risk that comps aren't pricing in. Stress-test before assuming the spread holds.
- At $5,335/mo this rent would consume 130% of the median local household income ($49k/yr) (locally 1906% of renters already pay >50% of income on rent) — very limited rent-growth headroom before tenants either downsize or default.
Questions for listing agent
- Can we see the unit-by-unit rent roll, current vacancy, and any below-market leases? What's the average tenancy length?
- What capital expenditures (roof, boiler, parking lot, exteriors) have been made in the last 5 years, and what's planned in the next 2?
- Built in 1926 — when were the roof, HVAC, electrical panel, plumbing, and water heater last replaced?
- Is there a deadline driving the sale (1031 exchange, divorce, estate, relocation)? That informs how much negotiation room exists.
- The area grade is low — what's the realistic commute time and amenity access for the typical tenant pool here? Any planned neighborhood developments (good or bad) we should know about?
- What's the average days-on-market for RENTAL listings here right now (not sales)? A rising rental-DOM trend means longer vacancies and softer asking-rent achievability than the comps imply.
- What's the recent tenant-quality profile in this submarket — average credit score on applications, eviction rate, late-payment / NSF rate, and stable-employment percentage? A property-management company in the area should have these aggregated.
- How much new apartment / multifamily construction is in the pipeline within 1–3 miles? Heavy new supply (>2% of stock underway) typically softens rents 12–24 months out; light construction supports rent growth.
CashFlowRE · CFR-PA9P007SCZW03D
· Data 2 days ago
cashflowre.app · 2026-05-29