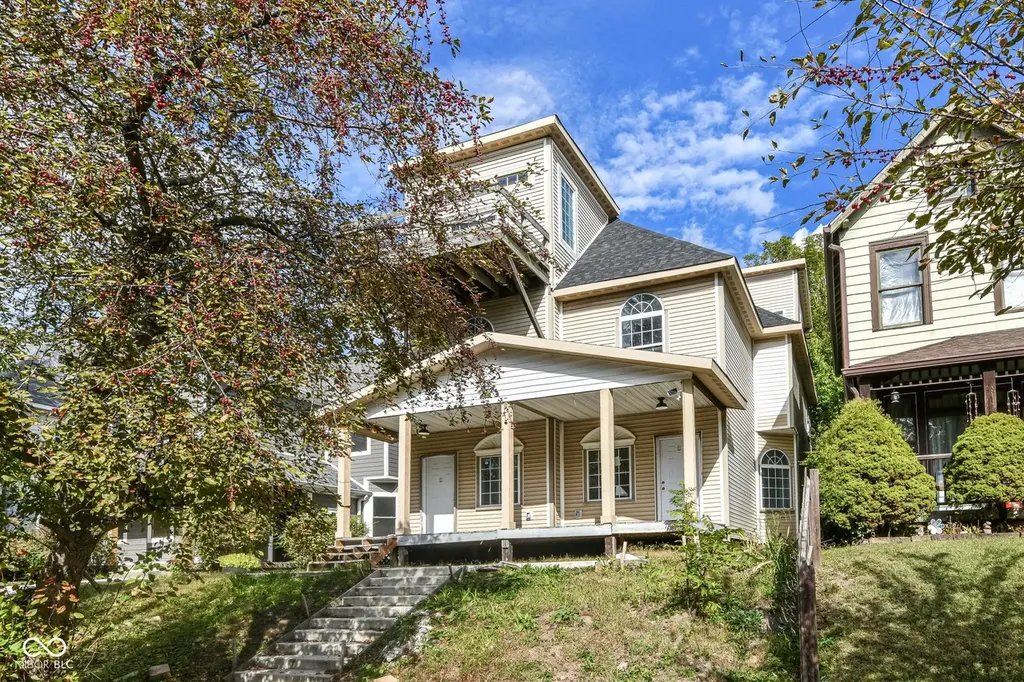
 Fourplex
1213 N Newman St · Indianapolis city (balance), IN
Flood risk 1/10 · Minimal
- FEMA flood zone
- X (unshaded)
- Chance of flooding over 30 yrs
- 0.0%
- Est. flood insurance / yr
- $473 – $860
Fire risk 1/10 · Minimal
- Est. fire insurance / yr
- $717 – $1,331
Heat risk 3/10 · Minor
- Hot days now (above 102°F)
- 7 days/yr
- Hot days in 30 yrs
- 19 days/yr
Wind risk 2/10 · Minimal
- Chance of severe wind over 30 yrs
- 0.0%
Air-quality risk 4/10 · Minor
- Unhealthy air days now
- 5 days/yr
- Unhealthy air days in 30 yrs
- 7 days/yr
Risk factors via First Street. Map © Google.
Why this score? — see what drove the D+ grade
The composite is a weighted blend of 9 inputs, each scored 0–100. Each bar is that input's sub-score; the figure is the points it added to the 100-point composite (weight × sub-score).
- Cash flow +19.3/30.0
- ARV discount +7.5/15.0
- DSCR +6.1/10.0
- 1% rule +5.2/10.0
- Rent growth +4.3/5.0
- Livability +2.5/5.0
- Condition / age +2.5/5.0
- Schools +1.4/10.0
- Appreciation +0.0/10.0
$525,000
🖨 Deal sheet 📄 Offer letter ✓ Due diligence
Multi-family units
County records classify this as Multi-Family (2-4 Unit). Listing-text estimate: 4 units. confirmed
Listing remarks
Recently renovated this quadplex offers an exceptional investment opportunity in one of the city's most desirable and rapidly developing locations. Each upper unit features 3 bedrooms and 2 full baths, while the two lower-level units offer 1 bedroom and 1 bath, creating an ideal mix of unit sizes for strong rental demand and income flexibility. The property has been updated with newer furnace systems, water heaters, modern finishes, and thoughtfully designed layouts throughout, leaving zero deferred maintenance for the next owner. Positioned near major employers, downtown access, and popular neighborhood amenities, this high-yield asset is surrounded by continued growth and development, mak
Key facts
- Modern finishes
- Recently renovated
- 5,227 sq ft lot
Tags
Property features AI
Finance
- Other: Possible uses include residential or apartments; Lot size approximately 0.12 acre (< 1/4 acre); Zoned for multi-unit (2-4 units)
- Financial info: Four-unit income property; Reported gross income: 0; Reported expenses: 0; Unit rents listed as 0 (monthly) — verify current rents
Exterior
- Parking: On-street and unpaved parking available; 4 garage spaces
- Utilities: Solid waste service: not available; Unit utilities include forced heat
- Home design: Residential income property (quadruplex); Converted property; Three or more levels
- Construction: Unfinished basement
- Exterior features: Balcony; Access road frontage
Interior
- Kitchen: Each unit has a kitchen (unit kitchens noted: ~300 and ~250 — indicative of kitchen presence)
- Bedrooms: Four units total: three-bedroom units and one-bedroom units
- Heating & cooling: Forced air heating; No central cooling
- Interior features: Updated/remodeled condition; Has a view; Balcony
- Laundry & utility: Laundry room with all hookups and dedicated laundry room; Basement utility space (unfinished)
Neighborhood map
What this means for you Summary
Snapshot
- This is a 2×3bd/2ba + 2×1bd/1ba units multifamily listed at $525k.
Deal economics
- At list price, monthly cash flow is $576 ($7k/yr) — positive. Per door: $144/mo.
- The deal already cash-flows at list — no discount required.
- Meets the 1% rule at list price ($5k rent vs $525k).
- Cap rate 7.6% vs local median 4.4% in Indianapolis city (balance) — top-decile yield for the area; either an underpriced asset or a hidden risk that comps aren't pricing in. Stress-test before assuming the spread holds.
Location & tenants
- Location reads: area grade D — affects rentability + tenant quality, not the cash-flow math above.
- Indianapolis Public Schools (urban): math 14% / reading 20% proficiency, ranked #286 of 301 in IN (top 95%) — low school quality limits family demand, transient renter base, plan for 1-2y turnover; 77% free/reduced lunch — lower-income household profile, screen leases tightly.
- Market conditions: Rents rising fast (+7.3%/yr); 480 active listings in the ZIP; 27 comparable units currently listed for rent nearby; rentals at typical pace (median 24d on market — plan ~3-4 weeks tenant-placement turnaround); 1,906 units permitted in Marion County in 2024 (621 in 5+ unit buildings).
- At $5,335/mo this rent would consume 130% of the median local household income ($49k/yr) (locally 1906% of renters already pay >50% of income on rent) — very limited rent-growth headroom before tenants either downsize or default.
Forward outlook
- Local home prices are declining (-3.0%/yr); year-one equity from $4k of loan paydown is wiped out by about $16k of value loss. Plan a longer hold.
- Marion County population projected at +18% by 2050 — long-run rental-demand tailwind backs the buy-and-hold thesis.
- At projected returns (-3.0% appreciation + 7.3% rent growth), your $147k cash investment doubles in ~10 years — after that, you're playing with house money.
Negotiation context
- Only 8 days on market — expect competitive offers; lowballing is unlikely to land.
- 5 sale attempts since 2y ago with the ask held roughly flat each time — persistent listings suggest the price (not the market) is what's stuck; bring a comps-based counter.
- Current owner paid $230k; list at $525k implies a 128% gain — meaningful room to come down on a strong offer.
Risks & watch-outs
- Watch-outs: built in 1926 — expect roof / HVAC / electrical / plumbing capex.
Questions for the listing agent
- Can we see the unit-by-unit rent roll, current vacancy, and any below-market leases? What's the average tenancy length?
- What capital expenditures (roof, boiler, parking lot, exteriors) have been made in the last 5 years, and what's planned in the next 2?
- Built in 1926 — when were the roof, HVAC, electrical panel, plumbing, and water heater last replaced?
- Is there a deadline driving the sale (1031 exchange, divorce, estate, relocation)? That informs how much negotiation room exists.
- The area grade is low — what's the realistic commute time and amenity access for the typical tenant pool here? Any planned neighborhood developments (good or bad) we should know about?
- What's the average days-on-market for RENTAL listings here right now (not sales)? A rising rental-DOM trend means longer vacancies and softer asking-rent achievability than the comps imply.
- What's the recent tenant-quality profile in this submarket — average credit score on applications, eviction rate, late-payment / NSF rate, and stable-employment percentage? A property-management company in the area should have these aggregated.
- How much new apartment / multifamily construction is in the pipeline within 1–3 miles? Heavy new supply (>2% of stock underway) typically softens rents 12–24 months out; light construction supports rent growth.
Investment metrics
- 1% rule
- 1.02% ✓
- Cap rate
- 7.61%
- Cash-on-cash
- 4.70%
- DSCR
- 1.21
- GRM
- 8.2
CMA / ARV
- ARV (median comp)
- $314,345
- List price
- $525,000
- Delta
- 67.01%
- Verdict
- OVERPRICED
- Comps
- 20 within 1.0 mi
Projected returns pro-forma
-3.0% appreciation · 7.31% rent growth · sell at horizon
- IRR
- -4.2%
- Equity multiple
- 0.84×
- Total profit
- $-24,153
- Equity at exit
- $78,279
- IRR
- 9.9%
- Equity multiple
- 1.92×
- Total profit
- $134,850
- Equity at exit
- $45,392
Cash invested: $147,000 (down + closing). Projections, not guarantees.
Landlord ↔ Tenant lean methodology
- Overall (STATE)
- 90 Strongly Landlord-Friendly
- State Indiana
- 90 Strongly Landlord-Friendly · R+11
- County
- — inherits STATE
- City
- — inherits STATE
ZIP-level market 46201
- Home prices YoY
- -33.9%
- Rents YoY
- 7.3%
- Active inventory
- 480
- Price-to-rent
- 28.2×
Monthly cashflow live
- Estimated rent
- $5,335 high interval (Pro) →
- Mortgage (P&I)
- −$2,753
- Tax from tax record
- −$667 /mo · $7,999/yr
- Insurance
- −$219
- HOA
- −$0
- Vacancy / Maint / Mgmt
- −$1,120
- Net cashflow
- $576
Break-even live
4-unit breakdown (identical units grouped — click to expand)
| Units | Beds | Baths | Est. rent |
|---|---|---|---|
| 2× units | 3 | 2 | $3,104 |
| #1 | 3 | 2 | $1,552 |
| #2 | 3 | 2 | $1,552 |
| 2× units | 1 | 1 | $2,232 |
| #3 | 1 | 1 | $1,116 |
| #4 | 1 | 1 | $1,116 |
| Total (4 units) | $5,335 | ||
UW: 25.0% down · 7.5% · 30yr · 1.5% tax · 5.0% vac · 8.0% maint · 8.0% mgmt
Financing live
Cash to close
- Down payment
- $131,250
- Closing costs
- $15,750
- Reserves months
- —
- Total cash needed
- —
Loan-product check · same deal, 3 products live
Conventional
25% down · 7.5% · 30yr
- Down + closing
- —
- Monthly P&I
- —
- Monthly cashflow
- —
- DSCR
- —
- Eligible?
- —
Personal DTI + credit; lowest rate.
DSCR
20% down · 8.5% · 30yr
- Down + closing
- —
- Monthly P&I
- —
- Monthly cashflow
- —
- DSCR
- —
- Eligible?
- —
No personal income docs; deal must DSCR.
Hard money
10% down · 12.0% · 12mo
- Down + closing
- —
- Monthly P&I
- —
- Monthly cashflow
- —
- DSCR
- —
- Eligible?
- —
Short-term bridge; refi at stabilization.
Rent comps 27 comps
| Address | Beds | Baths | Sqft | Rent | $/sqft | DOM | Units | Dist |
|---|---|---|---|---|---|---|---|---|
| 945 Woodruff Place Middle Dr Unit 4 Indianapolis, IN | 2.0 | 1.5 | 1532 | $1,595 | $1.04 | 43d | 1 | 0.29mi |
| 1314 E 10th St Indianapolis, IN | 2.0 | 2.0 | 1701 | $1,650 | $0.97 | 44d | 1 | 0.31mi |
| 2418 E 16th St Indianapolis, IN | 2.0 | 1.5 | 1863 | $2,125 | $1.14 | 23d | 1 | 0.62mi |
| 2536 E 17th St Indianapolis, IN | 2.0 | 2.0 | 2086 | $1,450 | $0.70 | 4d | 1 | 0.76mi |
| 441 N Highland Ave Unit 445 Indianapolis, IN | 2.0 | 2.5 | 1650 | $2,400 | $1.45 | 43d | 1 | 0.78mi |
| 441 N Highland Ave Indianapolis, IN | 2.0 | 2.0 | 1650 | $2,400 | $1.45 | 43d | 1 | 0.78mi |
| 852 N Rural St Indianapolis, IN | 2.0 | 1.5 | 1528 | $1,300 | $0.85 | 23d | 1 | 0.82mi |
| 1623 N Rural St Indianapolis, IN | 2.0 | 1.0 | 1452 | $875 | $0.60 | 43d | 1 | 0.87mi |
| 615 E 11th St Indianapolis, IN | 2.0 | 2.5 | 1502 | $2,595 | $1.73 | 23d | 1 | 0.87mi |
| 706 Massachusetts Ave Indianapolis, IN | 2.0 | 2.5 | 1908 | $2,700 | $1.42 | 11d | 1 | 0.99mi |
| 1228 Central Ave Indianapolis, IN | 2.0 | 1.5 | 1599 | $1,950 | $1.22 | 12d | 1 | 1.00mi |
| 800 N Park Ave Indianapolis, IN | 2.0 | 2.0 | 2101 | $2,000 | $0.95 | 21d | 1 | 1.01mi |
| 515 N Oxford St Indianapolis, IN | 2.0 | 1.5 | 1728 | $1,050 | $0.61 | 3d | 1 | 1.04mi |
| 533 Leon St Unit 1 Indianapolis, IN | 2.0 | 2.5 | 1600 | $2,375 | $1.48 | 14d | 1 | 1.09mi |
| 918 Fort Wayne Ave Indianapolis, IN | 1.0–3.0 | 1.0–3.0 | 1239 | $1,450 | $1.17 | 43d | 1 | 1.14mi |
| 1529 N Alabama St Indianapolis, IN | 2.0 | 3.5 | 2673 | $3,750 | $1.40 | 43d | 1 | 1.14mi |
| 1813 Livery Way Indianapolis, IN | 2.0 | 2.5 | 1715 | $2,490 | $1.45 | 3d | 1 | 1.15mi |
| 441 E North St Unit 441 Indianapolis, IN | 2.0 | 2.5 | 1650 | $2,400 | $1.45 | 43d | 1 | 1.16mi |
| 501n N New Jersey St Unit 1378235P Indianapolis, IN | 2.0 | 1.0–2.0 | 1006 | $3,404 | $3.38 | 3d | 2 | 1.19mi |
| 2124 Broadway St Unit 4 Indianapolis, IN | 1.0 | 1.0 | 2730 | $1,075 | $0.39 | 21d | 1 | 1.20mi |
| 1473 N Delaware St Indianapolis, IN | 2.0 | 1.5 | 1572 | $1,600 | $1.02 | 14d | 1 | 1.23mi |
| 650 Alabama St Indianapolis, IN | 3.0 | 1.0–2.5 | 1099 | $1,844 | $1.68 | 16d | 27 | 1.27mi |
| 2136 Central Ave Indianapolis, IN | 3.0 | 1.0–2.0 | 1325 | $2,032 | $1.53 | 1d | 33 | 1.35mi |
| 1519 N Gale St Indianapolis, IN | 2.0 | 1.5 | 1552 | $1,295 | $0.83 | 43d | 1 | 1.37mi |
| 1321 N Meridian St Indianapolis, IN | 2.0 | 1.0–2.0 | 1013 | $1,458 | $1.44 | 3d | 92 | 1.39mi |
| 613 Fort Wayne Ave Indianapolis, IN | 2.0 | 2.0 | 1510 | $2,395 | $1.59 | 23d | 1 | 1.40mi |
| 333 Massachusetts Ave Indianapolis, IN | 2.0 | 2.0 | 2148 | $4,000 | $1.86 | 43d | 1 | 1.48mi |
Listing history 23 events
-
2026-06-18days on market $525,000 Active 8 DOM
-
2026-06-17days on market $525,000 Active 7 DOM
-
2026-06-16days on market $525,000 Active 6 DOM
-
2026-06-15days on market $525,000 Active 5 DOM
-
2026-06-13days on market $525,000 Active 3 DOM
-
2026-06-13days on market $525,000 Active 2 DOM
-
2026-06-08days on market $525,000 Active 31 DOM
-
2026-06-07pricedays on market $525,000 Active 30 DOM
-
2026-06-03days on market $549,900 Active 26 DOM
-
2026-06-02days on market $549,900 Active 25 DOM
-
2026-06-01days on market $549,900 Active 24 DOM
-
2026-05-31days on market $549,900 Active 23 DOM
-
2026-05-08$575,000 Active 809-char remark
-
2025-11-04historical
-
2025-10-29price $585,000
-
2025-10-14$599,000 Active
-
2024-03-18soldstatus $230,000 Closed
-
2024-02-07status Pending
-
2024-02-07price $239,999
-
2024-01-29price $249,900
-
2024-01-29$249,999 Active
-
2024-01-29historical
-
2024-01-16$249,999 Active
ⓘ Source: listings_history table (triggers on properties + properties_extension) + one-shot
backfill from property_details.listing_events for pre-trigger history.
Tax reassessment forecast IN · Partial reset (capped growth)
- Current annual tax
- $7,999 · $667/mo
- Projected year-2 tax
- $7,999 · $667/mo
- Expected delta
- $0/yr ($0/mo · 0.0%)
ⓘ Screening estimate from a state-policy table — verify with the county assessor before closing.
Climate risk First Street
- Flood 1/10 Low FEMA zone X (unshaded) · 0% chance over 30 yrs
- Wildfire 1/10 Low
- Heat 3/10 Moderate 7 d/yr ≥102°F today · 19 d/yr by 30 yrs out
- Wind 2/10 Low 0% chance of damaging wind over 30 yrs
- Air quality 4/10 Moderate 5 unhealthy d/yr today · 7 by 30 yrs out
Nearby sold comps map
Loading sold comps map…
Walkable amenities ~0.75 mi
Loading nearby amenities…
Taxation est. · year 1
- Rental income
- $64,020
- − Mortgage interest
- −$29,408
- − Property taxes
- −$7,999
- − Insurance
- −$2,625
- − Repairs & maintenance
- −$5,122
- − Management
- −$5,122
- − Depreciation
- −$15,273
- Taxable loss
- −$1,528
- Est. tax savings @ 24.0%
- +$367
- After-tax cash flow
- $7,280/yr
For passive investors: Depreciation is non-cash, so a rental often shows a tax loss while cash-flowing — sheltering income. Rental losses are passive: they offset passive income freely, and up to $25,000/yr can offset ordinary (W-2) income if you actively participate and your MAGI is under $100k (phasing out to $0 by $150k); unused losses carry forward. On sale, claimed depreciation is recaptured at up to 25%, and gains may owe capital-gains tax (a 1031 exchange can defer both). Figures are a year-1 estimate at your 24.0% rate — not tax advice; consult a CPA.
Schools (NCES district)
- District
- Indianapolis Public Schools
- NCES district ID
- 1804770
- Math proficiency
- 14% ▼ -7.00%
- Reading proficiency
- 20% ▼ -3.00%
- Median HH income
- $32,034
- Composite
- 13.69/100
- National rank
- #9499
- State rank
- #286 of 301 in IN
Livability — Indianapolis city (balance)
No livability data for this city. (Only ~50 U.S. cities are tracked.)
Census & demographics
- Census place
- Indianapolis city (balance), IN
- County
- Marion County · 998,460 people
- City population
- 881,119
- Metro
- Indianapolis-Carmel-Anderson, IN
- Population (ZIP)
- 30,335
- Household income
- $49,195
- Rent vs Own
- Severe rent burden
- 1906.0
Population outlook (Marion County) Hauer SSP2
- Today (2025)
- 1,025,572 people
- By 2030
- 1,065,727 · +3.9%
- By 2040
- 1,141,577 · +11.3%
- By 2050
- 1,208,920 · +17.9%
- By 2075
- 1,367,288 · +33.3%
- By 2100
- 1,438,201 · +40.2%
Race, ethnicity, and origin ACS 2023
- Neighborhood character
- Diverse neighborhood (Simpson 0.63)
- Race & ethnicity
- White 53% Hispanic / Latino 23% Black 18% Two or more races 9%
- Hispanic origin (detail)
- Mexican 14% Puerto Rican 2%
- Common ancestry
- Slovak 2% Lithuanian 2% Italian 1%
- Foreign-born
- 9% · Canada
- Languages at home
- 81% English-only · Spanish 17%
Political lean MEDSL · Marion
- 2024 margin
- Strong D (+27.7) · D 63.0% · R 35.3% · Other 1.7%
- 2008→2024 swing
- -0.7pp no change · 2008: 28.4pp · 2024: 27.7pp
- All cycles
- 2024: D+27.7 2020: D+29.1 2016: D+22.8 2012: D+22.2 2008: D+28.4
Not yet ingested
- Civics
- —
Market trends
- HPI YoY
- ▼ -192.51%
- Current HPI
- 375.0969
- Rent YoY
- ▲ 7.31%
- Metro
- Indianapolis-Carmel-Anderson, IN
- State GDP YoY
- ▲ 2.90%
- F500 in state
- 18
Industry mix (Fortune 500 HQ in IN)
| Industry | F500 HQs | Revenue |
|---|---|---|
| Industrial Machinery | 2 | $37B |
|
||
| Healthcare | 1 | $177B |
|
||
| Pharmaceuticals | 1 | $45B |
|
||
| Metals / Steel | 1 | $18B |
|
||
| Agriculture | 1 | $17B |
|
||
| Packaging | 1 | $12B |
|
||
Price history
+110.0% since first listed15 events — show timeline
- 2026-06-10 Listed $525,000 MIBOR as Distributed by MLS Grid
- 2026-06-08 Listing Removed — MIBOR as Distributed by MLS Grid
- 2026-06-05 Price Changed $525,000 MIBOR as Distributed by MLS Grid
- 2026-05-21 Price Changed $549,900 MIBOR as Distributed by MLS Grid
- 2026-05-08 Listed $575,000 MIBOR as Distributed by MLS Grid
- 2025-11-04 Listing Removed — MIBOR as Distributed by MLS Grid
- 2025-10-29 Price Changed $585,000 MIBOR as Distributed by MLS Grid
- 2025-10-14 Listed $599,000 MIBOR as Distributed by MLS Grid
- 2024-03-18 Sold (MLS) $230,000 MIBOR as Distributed by MLS Grid
- 2024-02-07 Pending — MIBOR as Distributed by MLS Grid
- 2024-02-07 Price Changed $239,999 MIBOR as Distributed by MLS Grid
- 2024-01-29 Price Changed $249,900 MIBOR as Distributed by MLS Grid
- 2024-01-29 Listing Removed — MIBOR as Distributed by MLS Grid
- 2024-01-29 Listed $249,999 MIBOR as Distributed by MLS Grid
- 2024-01-16 Listed $249,999 MIBOR as Distributed by MLS Grid
Property tax history
+32.1%/yrLatest (2025): $7,999 · +104.7% YoY. Source: county tax records.
Cash-flow waterfall
monthlySold comps — $/sqft
last 12 mo · ≤1 miLoading sold comps…