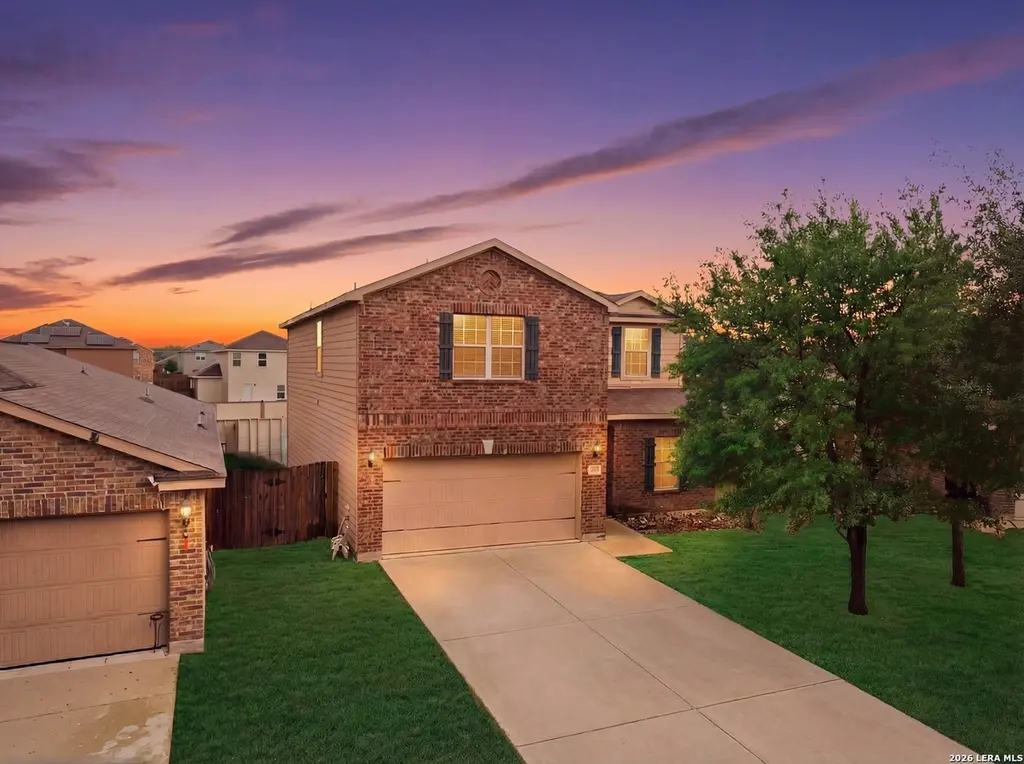
11758 Luckey
San Antonio, TX 78252
$239,999C-
3 bd · 2.5 ba ·
2,581 sqft ·
Built 2011
· SingleFamily
· Pending
· 72 DOM
Cashflow @ list (25.0% down · 7.5%)
Estimated rent
$1,968/mo
Mortgage (P&I)
−$1,259
Tax + insurance
−$311
HOA
−$20
Vac / Maint / Mgmt
−$413
Net cashflow
$-35/mo
Annual
$-417/yr
Cap rate
6.12%
Cash-on-cash
-0.62%
DSCR
0.97
1% rule
0.82%
Cash to close
$67,200
Investor read
- This is a 3-bed/2.5-bath single-family listed at $240k.
- At list price, monthly cash flow is $-35 ($-417/yr) — negative.
- To cash-flow at today's rent, offer at most $234k (2.6% below list).
- To meet the 1% rule (rent ≥ 1% of price), the offer needs to be $197k (18.0% below list).
- It's been on market 72 days — a 6% lower offer ($226k) is reasonable based on typical stale-listing flexibility.
- Recommended offer: $197k (18.0% below list) — sets the bar for 1% rule.
- In year one you build about $2k of equity ($2k loan paydown + $-4 appreciation (-0.0% local appreciation)).
- Location reads 80/100 on livability (#31 in TX, #1,616 nationally) — a professional / high-income tenant draw. Strengths: amenities A+, commute A+, cost of living A+; Watch: schools C-, crime F.
- Medina Valley ISD (rural): math 48% / reading 53% proficiency, ranked #148 of 826 in TX (top 18%) — acceptable for families but not a draw, mixed tenant base, ~2y average lease.
- Market conditions: Rents soft (-1.7%/yr); 537 active listings in the ZIP; 33 comparable units currently listed for rent nearby; rentals at typical pace (median 24d on market — plan ~3-4 weeks tenant-placement turnaround); solid renter incomes; 8,308 units permitted in Bexar County in 2024 (2,506 in 5+ unit buildings).
- Bexar County population projected at +50% by 2050 — long-run rental-demand tailwind backs the buy-and-hold thesis.
- 2 sale attempts since 15y ago with the ask held roughly flat each time — persistent listings suggest the price (not the market) is what's stuck; bring a comps-based counter.
- Climate carrying-cost: severe wind risk, 80% chance of damaging wind over 30y; extreme-heat days projected 7→23/yr by 2055 (HVAC capex compounding) — expect insurance premiums to compound above CPI over the hold.
- Cap rate 6.1% vs local median 3.8% in San Antonio — top-decile yield for the area; either an underpriced asset or a hidden risk that comps aren't pricing in. Stress-test before assuming the spread holds.
Questions for listing agent
- What do current leases actually rent for vs. the listed asking? Can we see a recent rent roll and the last 12 months of T-12 income?
- It's been on market 72 days. Have you received any prior offers? Is the seller open to a 18% concession, seller financing, or rate buy-down credit?
- What does the HOA fee cover, when was the last increase, and are there any pending special assessments or reserve-fund shortfalls?
- Why hasn't it sold? Are there any deal-killer items the seller is aware of (foundation, flood, title, zoning, code violations)?
- Is there a deadline driving the sale (1031 exchange, divorce, estate, relocation)? That informs how much negotiation room exists.
- Crime grade is F in this area — have there been break-ins, vandalism, or insurance claims at this property in the last 3 years? What carrier currently insures it and at what premium?
- What's the average days-on-market for RENTAL listings here right now (not sales)? A rising rental-DOM trend means longer vacancies and softer asking-rent achievability than the comps imply.
- What's the recent tenant-quality profile in this submarket — average credit score on applications, eviction rate, late-payment / NSF rate, and stable-employment percentage? A property-management company in the area should have these aggregated.
CashFlowRE · CFR-PC41RS6S286FC5
· Data 4 days ago
cashflowre.app · 2026-05-29