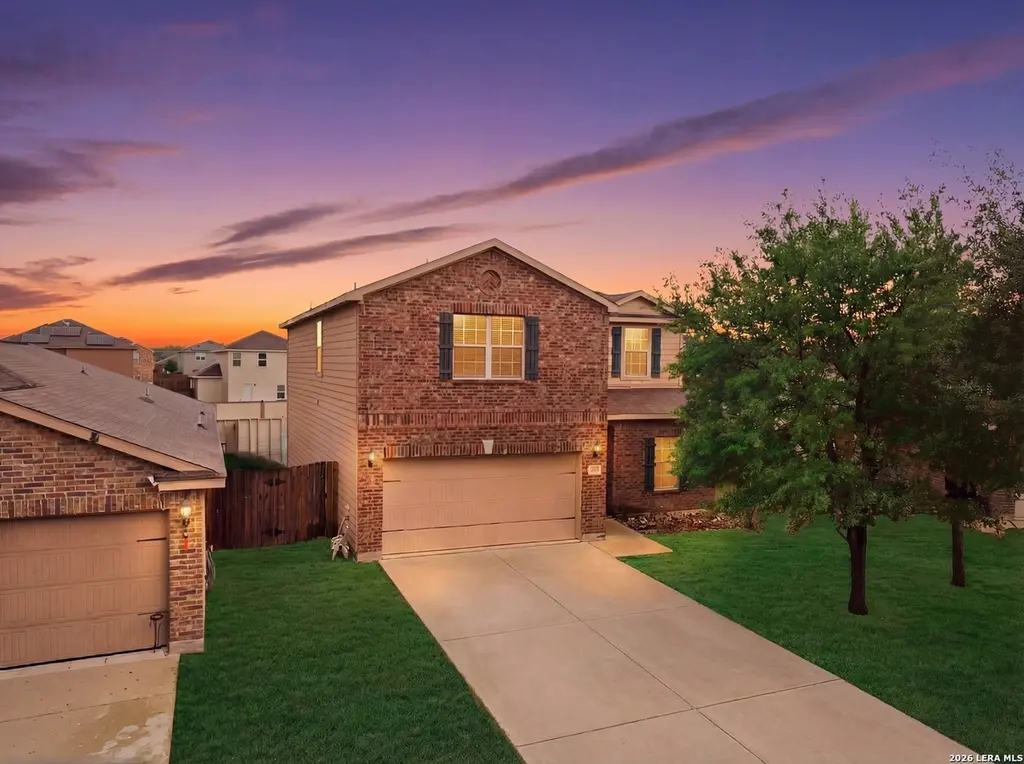
11758 Luckey · San Antonio, TX
Flood risk 1/10 · Minimal
- FEMA flood zone
- X (unshaded)
- Chance of flooding over 30 yrs
- 0.0%
- Est. flood insurance / yr
- $507 – $1,088
Fire risk 3/10 · Minor
- Est. fire insurance / yr
- $1,222 – $2,270
Heat risk 8/10 · Major
- Hot days now (above 109°F)
- 7 days/yr
- Hot days in 30 yrs
- 23 days/yr
Wind risk 8/10 · Major
- Chance of severe wind over 30 yrs
- 80.0%
Air-quality risk 2/10 · Minimal
- Unhealthy air days now
- 1 days/yr
- Unhealthy air days in 30 yrs
- 1 days/yr
Risk factors via First Street. Map © Google.
Why this score? — see what drove the C- grade
The composite is a weighted blend of 9 inputs, each scored 0–100. Each bar is that input's sub-score; the figure is the points it added to the 100-point composite (weight × sub-score).
- ARV discount +15.0/15.0
- Cash flow +12.5/30.0
- Appreciation +5.0/10.0
- Schools +4.4/10.0
- Livability +4.0/5.0
- DSCR +3.7/10.0
- 1% rule +3.2/10.0
- Condition / age +2.5/5.0
- Rent growth +2.1/5.0
$239,999
🖨 Deal sheet 📄 Offer letter ✓ Due diligence
Listing remarks MLS
PRICED TO SELL! Spacious 5-bedroom, 3.5-bath home offering plenty of room for a growing family. This well-maintained property features a large backyard and a functional layout ideal for everyday living and entertaining. The home does require minor foundation work, and pricing reflects this. Seller is willing to complete repairs prior to closing, making this a great opportunity for both retail buyers and investors. Don't miss your chance schedule your showing and bring your offer!
Key facts
- Large backyard
- Functional layout
- 7,013 sq ft lot
Tags
Neighborhood map
What this means for you Summary
Snapshot
- This is a 3-bed/2.5-bath single-family listed at $240k.
Deal economics
- At list price, monthly cash flow is $-35 ($-417/yr) — negative.
- To cash-flow at today's rent, offer at most $234k (2.6% below list).
- To meet the 1% rule (rent ≥ 1% of price), the offer needs to be $197k (18.0% below list).
- Recommended offer: $197k (18.0% below list) — sets the bar for 1% rule.
- Cap rate 6.1% vs local median 3.8% in San Antonio — top-decile yield for the area; either an underpriced asset or a hidden risk that comps aren't pricing in. Stress-test before assuming the spread holds.
Location & tenants
- Location reads 80/100 on livability (#31 in TX, #1,616 nationally) — a professional / high-income tenant draw. Strengths: amenities A+, commute A+, cost of living A+; Watch: schools C-, crime F.
- Medina Valley ISD (rural): math 48% / reading 53% proficiency, ranked #148 of 826 in TX (top 18%) — acceptable for families but not a draw, mixed tenant base, ~2y average lease.
- Market conditions: Rents soft (-1.7%/yr); 537 active listings in the ZIP; 33 comparable units currently listed for rent nearby; rentals at typical pace (median 24d on market — plan ~3-4 weeks tenant-placement turnaround); solid renter incomes; 8,308 units permitted in Bexar County in 2024 (2,506 in 5+ unit buildings).
Forward outlook
- In year one you build about $2k of equity ($2k loan paydown + $-4 appreciation (-0.0% local appreciation)).
- Bexar County population projected at +50% by 2050 — long-run rental-demand tailwind backs the buy-and-hold thesis.
Negotiation context
- It's been on market 72 days — a 6% lower offer ($226k) is reasonable based on typical stale-listing flexibility.
- 2 sale attempts since 15y ago with the ask held roughly flat each time — persistent listings suggest the price (not the market) is what's stuck; bring a comps-based counter.
Risks & watch-outs
- Climate carrying-cost: severe wind risk, 80% chance of damaging wind over 30y; extreme-heat days projected 7→23/yr by 2055 (HVAC capex compounding) — expect insurance premiums to compound above CPI over the hold.
Questions for the listing agent
- What do current leases actually rent for vs. the listed asking? Can we see a recent rent roll and the last 12 months of T-12 income?
- It's been on market 72 days. Have you received any prior offers? Is the seller open to a 18% concession, seller financing, or rate buy-down credit?
- What does the HOA fee cover, when was the last increase, and are there any pending special assessments or reserve-fund shortfalls?
- Why hasn't it sold? Are there any deal-killer items the seller is aware of (foundation, flood, title, zoning, code violations)?
- Is there a deadline driving the sale (1031 exchange, divorce, estate, relocation)? That informs how much negotiation room exists.
- Crime grade is F in this area — have there been break-ins, vandalism, or insurance claims at this property in the last 3 years? What carrier currently insures it and at what premium?
- What's the average days-on-market for RENTAL listings here right now (not sales)? A rising rental-DOM trend means longer vacancies and softer asking-rent achievability than the comps imply.
- What's the recent tenant-quality profile in this submarket — average credit score on applications, eviction rate, late-payment / NSF rate, and stable-employment percentage? A property-management company in the area should have these aggregated.
- How much new for-sale + rental construction is in the pipeline within 1–3 miles? Heavy new supply typically softens prices + rents 12–24 months out; constrained supply supports both.
Investment metrics
- 1% rule
- 0.82% ✗
- Cap rate
- 6.12%
- Cash-on-cash
- -0.62%
- DSCR
- 0.97
- GRM
- 10.2
CMA / ARV
- ARV (median comp)
- $290,817
- List price
- $239,999
- Delta
- -17.47%
- Verdict
- UNDERPRICED
- Comps
- 20 within 1.0 mi
Show comp detail 7 sales within ~0.75 mi
| Address | Dist | Beds/Ba | Sqft | Sold | Price | $/sf | Match |
|---|---|---|---|---|---|---|---|
| 11811 Luckey Fls | 0.35mi | 4/2.5 (+1) | 2,245 (-13%) | 18mo | $289,000 | $129 | 42 |
| 11855 Davalos | 0.43mi | 4/2.5 (+1) | 2,202 (-15%) | 11mo | $284,900 | $129 | 41 |
| 11925 Luckey Riv | 0.37mi | 4/2.5 (+1) | 2,239 (-13%) | 18mo | $254,900 | $114 | 40 |
| 11926 Luckey Riv | 0.40mi | 4/2.5 (+1) | 2,239 (-13%) | 18mo | $244,900 | $109 | 39 |
| 11765 Alcoser Ct | 0.50mi | 4/2.5 (+1) | 2,202 (-15%) | 19mo | $280,000 | $127 | 31 |
| 7257 Jebson Pass | 0.73mi | 4/2.5 (+1) | 2,202 (-15%) | 16mo | $229,900 | $104 | 23 |
| 7010 Turnbow | 0.60mi | 4/2.5 (+1) | 2,199 (-15%) | 24mo | $275,000 | $125 | 23 |
Match score weights: distance 35% · size 25% · config 20% · recency 20%. Top-matched comps best support the ARV.
Projected returns pro-forma
-0.0% appreciation · 0.0% rent growth · sell at horizon
- IRR
- -4.9%
- Equity multiple
- 0.78×
- Total profit
- $-15,037
- Equity at exit
- $69,667
- IRR
- -1.0%
- Equity multiple
- 0.90×
- Total profit
- $-6,828
- Equity at exit
- $83,725
Cash invested: $67,200 (down + closing). Projections, not guarantees.
Landlord ↔ Tenant lean methodology
- Overall (STATE)
- 87 Strongly Landlord-Friendly
- State Texas
- 87 Strongly Landlord-Friendly · R+5
- County
- — inherits STATE
- City
- — inherits STATE
ZIP-level market 78252
- Home prices YoY
- -0.0%
- Rents YoY
- -1.7%
- Active inventory
- 537
- Price-to-rent
- 10.2×
Monthly cashflow live
- Estimated rent
- $1,968 high interval (Pro) →
- Mortgage (P&I)
- −$1,259
- Tax from tax record
- −$211 /mo · $2,533/yr
- Insurance
- −$100
- HOA
- −$20
- Vacancy / Maint / Mgmt
- −$413
- Net cashflow
- $-35
Break-even live
UW: 25.0% down · 7.5% · 30yr · 1.5% tax · 5.0% vac · 8.0% maint · 8.0% mgmt
Financing live
Cash to close
- Down payment
- $60,000
- Closing costs
- $7,200
- Reserves months
- —
- Total cash needed
- —
Loan-product check · same deal, 3 products live
Conventional
25% down · 7.5% · 30yr
- Down + closing
- —
- Monthly P&I
- —
- Monthly cashflow
- —
- DSCR
- —
- Eligible?
- —
Personal DTI + credit; lowest rate.
DSCR
20% down · 8.5% · 30yr
- Down + closing
- —
- Monthly P&I
- —
- Monthly cashflow
- —
- DSCR
- —
- Eligible?
- —
No personal income docs; deal must DSCR.
Hard money
10% down · 12.0% · 12mo
- Down + closing
- —
- Monthly P&I
- —
- Monthly cashflow
- —
- DSCR
- —
- Eligible?
- —
Short-term bridge; refi at stabilization.
Rent comps 33 comps
| Address | Beds | Baths | Sqft | Rent | $/sqft | DOM | Units | Dist |
|---|---|---|---|---|---|---|---|---|
| 11803 Luckey Vis San Antonio, TX | 3.0 | 2.5 | 1778 | $1,826 | $1.03 | 4d | 1 | 0.06mi |
| 11811 Wolf Cyn San Antonio, TX | 4.0 | 2.0 | 1893 | $1,725 | $0.91 | 43d | 1 | 0.17mi |
| 10843 Emerick St San Antonio, TX | 4.0 | 2.5 | 2400 | $2,300 | $0.96 | 4d | 1 | 0.25mi |
| 10858 Quinn Ct San Antonio, TX | 2.0–5.0 | 2.0–3.5 | 1733 | $2,067 | $1.19 | 1d | 1 | 0.27mi |
| 11543 Luckey Ledge San Antonio, TX | 4.0 | 2.0 | 1793 | $1,615 | $0.90 | 43d | 1 | 0.34mi |
| 11824 Luckey Fls San Antonio, TX | 4.0 | 2.5 | 2239 | $1,796 | $0.80 | 12d | 1 | 0.35mi |
| 6528 Dodger Vly San Antonio, TX | 4.0 | 2.0 | 1822 | $1,800 | $0.99 | 43d | 1 | 0.42mi |
| 11753 Alcoser Ct San Antonio, TX | 4.0 | 2.0 | 1792 | $1,589 | $0.89 | 21d | 1 | 0.51mi |
| 7204 Jebson Pass San Antonio, TX | 4.0 | 2.0 | 2202 | $1,900 | $0.86 | 14d | 1 | 0.65mi |
| 7216 Jebson Pass San Antonio, TX | 4.0 | 3.5 | 2205 | $5,200 | $2.36 | 1d | 1 | 0.66mi |
| 12241 Cashton San Antonio, TX | 3.0 | 2.5 | 1895 | $1,975 | $1.04 | 43d | 1 | 0.73mi |
| 12227 Stratsburg San Antonio, TX | 3.0 | 2.5 | 1895 | $1,759 | $0.93 | 23d | 1 | 0.80mi |
| 11655 Bakersfield Pass San Antonio, TX | 4.0 | 2.5 | 2268 | $2,185 | $0.96 | 2d | 1 | 0.87mi |
| 12251 Siragusa San Antonio, TX | 4.0 | 2.0 | 1822 | $2,050 | $1.13 | 2d | 1 | 0.88mi |
| 11643 Troubadour Trl San Antonio, TX | 4.0 | 3.5 | 2412 | $2,147 | $0.89 | 23d | 1 | 0.93mi |
| 11627 Troubadour Trl San Antonio, TX | 4.0 | 3.0 | 2497 | $2,350 | $0.94 | 23d | 1 | 0.95mi |
| 11620 Midnight Rain San Antonio, TX | 3.0 | 2.5 | 1780 | $1,850 | $1.04 | 43d | 1 | 1.00mi |
| 11620 Midnight Rain San Antonio, TX | 3.0 | 2.5 | 1780 | $1,795 | $1.01 | 21d | 1 | 1.00mi |
| 11732 Red Pheasant San Antonio, TX | 3.0 | 2.5 | 1780 | $1,795 | $1.01 | 23d | 1 | 1.01mi |
| 11806 Black Rose San Antonio, TX | 4.0 | 2.5 | 2100 | $2,150 | $1.02 | 43d | 1 | 1.04mi |
| 12507 Antilia San Antonio, TX | 3.0 | 3.0 | 2060 | $2,200 | $1.07 | 43d | 1 | 1.16mi |
| 12603 Antilia San Antonio, TX | 3.0 | 2.5 | 2058 | $1,795 | $0.87 | 4d | 1 | 1.17mi |
| 11502 Hocus Pocus San Antonio, TX | 3.0 | 2.5 | 2254 | $2,325 | $1.03 | 23d | 1 | 1.19mi |
| 11556 Mustang Grv San Antonio, TX | 3.0 | 2.0 | 1929 | $2,150 | $1.11 | 20d | 1 | 1.19mi |
| 4931 Jovian San Antonio, TX | 3.0 | 2.5 | 2058 | $1,795 | $0.87 | 23d | 1 | 1.20mi |
| 12528 Corona Borealis San Antonio, TX | 3.0 | 2.5 | 2058 | $1,795 | $0.87 | 23d | 1 | 1.25mi |
| 11230 Begonia Rock San Antonio, TX | 4.0 | 2.0 | 2090 | $1,925 | $0.92 | 43d | 1 | 1.25mi |
| 4715 Corona Australis San Antonio, TX | 3.0 | 2.5 | 2081 | $1,950 | $0.94 | 43d | 1 | 1.38mi |
| 13078 Cygnus San Antonio, TX | 4.0 | 1.0–3.0 | 1656 | $1,911 | $1.15 | 1d | 8 | 1.43mi |
| 6441 Staccato Staff San Antonio, TX | 4.0 | 2.0 | 1906 | $1,950 | $1.02 | 4d | 1 | 1.45mi |
| 10903 Honey Crisp San Antonio, TX | 3.0–4.0 | 2.0–2.5 | 1719 | $1,699 | $0.99 | 1d | 47 | 1.46mi |
| 12879 Cygnus San Antonio, TX | 4.0 | 2.5 | 2121 | $2,150 | $1.01 | 21d | 1 | 1.46mi |
| 12879 Cygnus San Antonio, TX | 4.0 | 2.5 | 2120 | $2,150 | $1.01 | 43d | 1 | 1.46mi |
HOA detail
- Monthly dues
- $20 · $240/yr
Listing history 16 events
-
2026-06-16statusdays on market $239,999 Pending 72 DOM
-
2026-06-15days on market $239,999 Active 71 DOM
-
2026-06-13days on market $239,999 Active 69 DOM
-
2026-06-09days on market $239,999 Active 65 DOM
-
2026-06-08days on market $239,999 Active 64 DOM
-
2026-06-07days on market $239,999 Active 63 DOM
-
2026-06-04days on market $239,999 Active 60 DOM
-
2026-06-03days on market $239,999 Active 59 DOM
-
2026-06-02days on market $239,999 Active 58 DOM
-
2026-06-02days on market $239,999 Active 57 DOM
-
2026-05-31days on market $239,999 Active 56 DOM
-
2026-05-13price $239,999 484-char remark
Show marketing remark (484 chars)
PRICED TO SELL! Spacious 5-bedroom, 3.5-bath home offering plenty of room for a growing family. This well-maintained property features a large backyard and a functional layout ideal for everyday living and entertaining. The home does require minor foundation work, and pricing reflects this. Seller is willing to complete repairs prior to closing, making this a great opportunity for both retail buyers and investors. Don't miss your chance schedule your showing and bring your offer!
-
2026-04-20price $244,900 484-char remark
Show marketing remark (484 chars)
PRICED TO SELL! Spacious 5-bedroom, 3.5-bath home offering plenty of room for a growing family. This well-maintained property features a large backyard and a functional layout ideal for everyday living and entertaining. The home does require minor foundation work, and pricing reflects this. Seller is willing to complete repairs prior to closing, making this a great opportunity for both retail buyers and investors. Don't miss your chance schedule your showing and bring your offer!
-
2026-04-05$249,999 New 484-char remark
Show marketing remark (484 chars)
PRICED TO SELL! Spacious 5-bedroom, 3.5-bath home offering plenty of room for a growing family. This well-maintained property features a large backyard and a functional layout ideal for everyday living and entertaining. The home does require minor foundation work, and pricing reflects this. Seller is willing to complete repairs prior to closing, making this a great opportunity for both retail buyers and investors. Don't miss your chance schedule your showing and bring your offer!
-
2012-07-13historical
-
2011-11-15$178,900
ⓘ Source: listings_history table (triggers on properties + properties_extension) + one-shot
backfill from property_details.listing_events for pre-trigger history.
Tax reassessment forecast TX · Resets to sale price
- Current annual tax
- $2,533 · $211/mo
- Projected year-2 tax
- $4,392 · $366/mo
- Expected delta
- +$1,859/yr (+$155/mo · 73.4%)
ⓘ Screening estimate from a state-policy table — verify with the county assessor before closing.
Climate risk First Street
- Flood 1/10 Low FEMA zone X (unshaded) · 0% chance over 30 yrs
- Wildfire 3/10 Moderate
- Heat 8/10 Severe 7 d/yr ≥109°F today · 23 d/yr by 30 yrs out
- Wind 8/10 Severe 80% chance of damaging wind over 30 yrs
- Air quality 2/10 Low 1 unhealthy d/yr today · 1 by 30 yrs out
Nearby sold comps map
Loading sold comps map…
Walkable amenities ~0.75 mi
Loading nearby amenities…
Taxation est. · year 1
- Rental income
- $23,619
- − Mortgage interest
- −$13,444
- − Property taxes
- −$2,533
- − Insurance
- −$1,200
- − Repairs & maintenance
- −$1,890
- − Management
- −$1,890
- − HOA
- −$240
- − Depreciation
- −$6,982
- Taxable loss
- −$4,559
- Est. tax savings @ 24.0%
- +$1,094
- After-tax cash flow
- $677/yr
For passive investors: Depreciation is non-cash, so a rental often shows a tax loss while cash-flowing — sheltering income. Rental losses are passive: they offset passive income freely, and up to $25,000/yr can offset ordinary (W-2) income if you actively participate and your MAGI is under $100k (phasing out to $0 by $150k); unused losses carry forward. On sale, claimed depreciation is recaptured at up to 25%, and gains may owe capital-gains tax (a 1031 exchange can defer both). Figures are a year-1 estimate at your 24.0% rate — not tax advice; consult a CPA.
Schools (NCES district)
- District
- Medina Valley ISD
- NCES district ID
- 4830060
- Math proficiency
- 48% ▼ -9.00%
- Reading proficiency
- 53% ▼ -2.00%
- Median HH income
- $60,596
- Composite
- 44.2/100
- National rank
- #2851
- State rank
- #148 of 826 in TX
Livability — San Antonio
- Score
- 80/100
- State rank
- #31
- US rank
- #1616
Category grades
Schools grade is shown separately in the Schools card above.
Census & demographics
- County
- Bexar County · 1,990,555 people
- City population
- 1,806,925
- Metro
- San Antonio-New Braunfels, TX
- Population (ZIP)
- 21,790
- Household income
- $85,518
- Rent vs Own
- Severe rent burden
- 152.0
Population outlook (Bexar County) Hauer SSP2
- Today (2025)
- 2,336,851 people
- By 2030
- 2,560,728 · +9.6%
- By 2040
- 3,020,569 · +29.3%
- By 2050
- 3,493,522 · +49.5%
- By 2075
- 4,668,459 · +99.8%
- By 2100
- 5,533,242 · +136.8%
Race, ethnicity, and origin ACS 2023
- Neighborhood character
- Predominantly Hispanic (68%)
- Race & ethnicity
- Hispanic / Latino 68% Two or more races 29% White 17% Black 8% Asian 3% Native American 1%
- Hispanic origin (detail)
- Mexican 61% Puerto Rican 1%
- Common ancestry
- Hispanic 2% Lithuanian 1% German 1%
- Foreign-born
- 12% · Canada, South Korea
- Languages at home
- 58% English-only · Spanish 38% Tagalog/Filipino 2% Other Indo-European 1%
Political lean MEDSL · Bexar
- 2024 margin
- Lean D (+9.8) · D 54.3% · R 44.6% · Other 1.1%
- 2008→2024 swing
- +4.2pp toward D · 2008: 5.6pp · 2024: 9.8pp
- All cycles
- 2024: D+9.8 2020: D+18.2 2016: D+13.5 2012: D+4.6 2008: D+5.6
Not yet ingested
- Civics
- —
Market trends
- HPI YoY
- ▬ -0.00%
- Current HPI
- 183.6413
- Rent YoY
- ▼ -1.67%
- Metro
- San Antonio-New Braunfels, TX
- State GDP YoY
- ▲ 3.95%
- F500 in state
- 110
Industry mix (Fortune 500 HQ in TX)
| Industry | F500 HQs | Revenue |
|---|---|---|
| Energy | 16 | $1,198B |
|
||
| Technology | 5 | $198B |
|
||
| Engineering / Construction | 4 | $72B |
|
||
| Energy Services | 3 | $60B |
|
||
| Utilities | 3 | $41B |
|
||
| Healthcare | 2 | $330B |
|
||
Price history
+34.2% since first listed5 events — show timeline
- 2026-05-13 Price Changed $239,999 LERA
- 2026-04-20 Price Changed $244,900 LERA
- 2026-04-05 Listed $249,999 LERA
- 2012-07-13 Listing Removed — LERA
- 2011-11-15 Listed $178,900 LERA
Property tax history
+8.5%/yrLatest (2025): $2,533 · -57.9% YoY. Source: county tax records.
Cash-flow waterfall
monthlySold comps — $/sqft
last 12 mo · ≤1 miLoading sold comps…