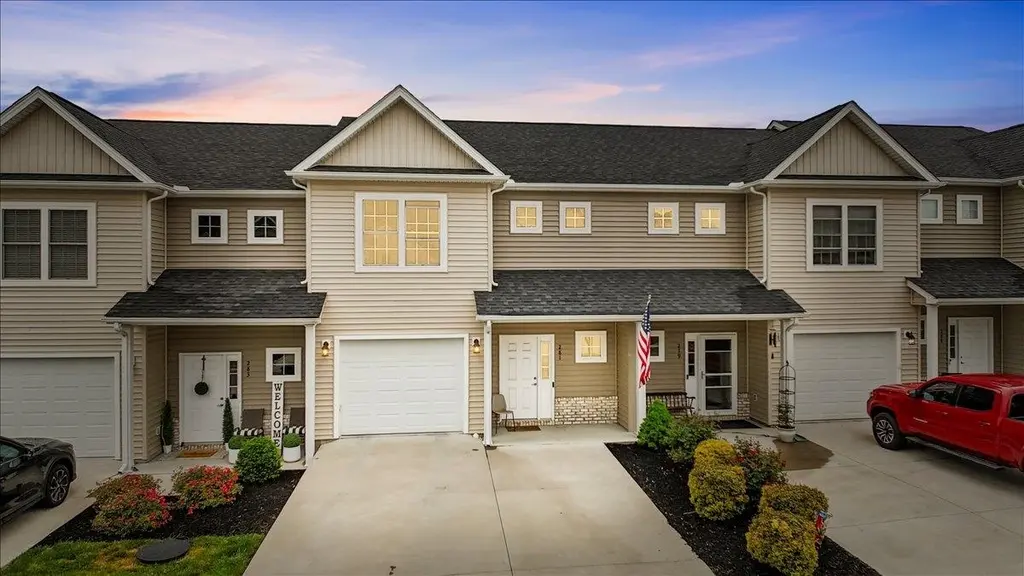
281 Louise Ln
Elliston, VA 24087
$285,000D-
3 bd · 2.5 ba ·
1,568 sqft ·
Built 2021
· Townhouse
· Pending
· 22 DOM
Cashflow @ list (25.0% down · 7.5%)
Estimated rent
$1,995/mo
Mortgage (P&I)
−$1,495
Tax + insurance
−$272
HOA
−$93
Vac / Maint / Mgmt
−$419
Net cashflow
$-283/mo
Annual
$-3,397/yr
Cap rate
5.10%
Cash-on-cash
-4.26%
DSCR
0.81
1% rule
0.70%
Cash to close
$79,800
Investor read
- This is a 3-bed/2.5-bath townhouse listed at $285k.
- At list price, monthly cash flow is $-283 ($-3k/yr) — negative.
- To cash-flow at today's rent, offer at most $235k (17.5% below list).
- To meet the 1% rule (rent ≥ 1% of price), the offer needs to be $200k (30.0% below list).
- It's been on market 22 days — a 2% lower offer ($281k) is reasonable based on typical stale-listing flexibility.
- Recommended offer: $200k (30.0% below list) — sets the bar for 1% rule.
- In year one you build about $30k of equity ($2k loan paydown + $28k appreciation (10.0% local appreciation)).
- Location reads 64/100 on livability (#342 in VA) — a middle-class / working-renter tenant base. Strengths: cost of living A+, housing A+, crime A; Watch: amenities F, commute F, employment F.
- Montgomery County Public School District (urban): math 57% / reading 70% proficiency, ranked #47 of 131 in VA (top 36%) — acceptable for families but not a draw, mixed tenant base, ~2y average lease.
- Zoned schools: Eastern Montgomery Elementary (math 27% / reading 42%, grade F, #966 of 1,108 statewide, top 89%, 385 students, 76% FRL); Eastern Montgomery High (math 72% / reading 77%, grade B+, #107 of 319 statewide, top 37%, 282 students, 62% FRL) — zoned schools average 69% FRL vs 32% district-wide (38 pts higher); higher-poverty schools than district average — tighter screening recommended.
- Market conditions: 33 active listings in the ZIP; 1 comparable units currently listed for rent nearby; 323 units permitted in Montgomery County in 2024 (0 in 5+ unit buildings).
- Montgomery County population projected at +13% by 2050 — modest demand growth; plan on rents tracking national, not racing it.
- 4 sale attempts since 5y ago with the ask held roughly flat each time — persistent listings suggest the price (not the market) is what's stuck; bring a comps-based counter.
- By year 2, paydown + projected appreciation supports a ~$49k cash-out refi (75% LTV) — recoverable capital for the next deal without selling this one.
Questions for listing agent
- What do current leases actually rent for vs. the listed asking? Can we see a recent rent roll and the last 12 months of T-12 income?
- What does the HOA fee cover, when was the last increase, and are there any pending special assessments or reserve-fund shortfalls?
- Is there a deadline driving the sale (1031 exchange, divorce, estate, relocation)? That informs how much negotiation room exists.
- The area grade is low — what's the realistic commute time and amenity access for the typical tenant pool here? Any planned neighborhood developments (good or bad) we should know about?
- What's the average days-on-market for RENTAL listings here right now (not sales)? A rising rental-DOM trend means longer vacancies and softer asking-rent achievability than the comps imply.
- What's the recent tenant-quality profile in this submarket — average credit score on applications, eviction rate, late-payment / NSF rate, and stable-employment percentage? A property-management company in the area should have these aggregated.
- How much new for-sale + rental construction is in the pipeline within 1–3 miles? Heavy new supply typically softens prices + rents 12–24 months out; constrained supply supports both.
CashFlowRE · CFR-PCXFD76NFD5WW7
· Data 4 days ago
cashflowre.app · 2026-05-29