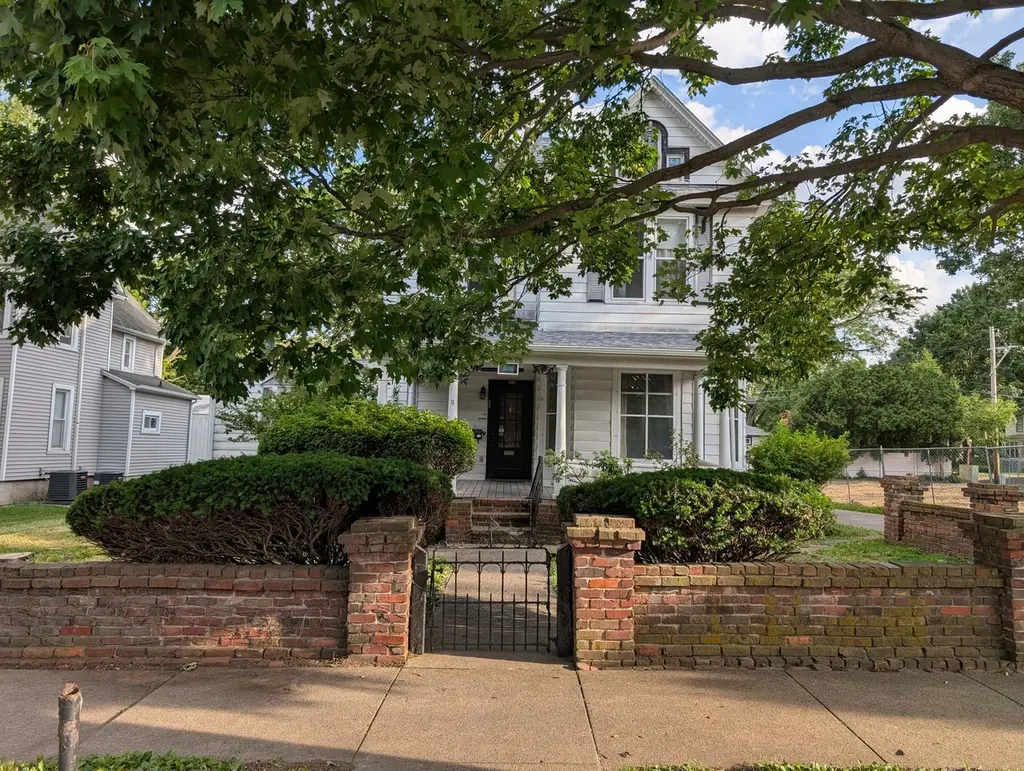
509 W Springfield Ave
Champaign, IL 61820
$150,000C
3 bd · 2.0 ba ·
2,246 sqft ·
Built 1900
· Other
· Pending
· 3 DOM
Cashflow @ list (25.0% down · 7.5%)
Estimated rent
$1,986/mo
Mortgage (P&I)
−$787
Tax + insurance
−$560
HOA
−$0
Vac / Maint / Mgmt
−$417
Net cashflow
$222/mo
Annual
$2,669/yr
Cap rate
8.07%
Cash-on-cash
6.35%
DSCR
1.28
1% rule
1.32%
Cash to close
$42,000
Investor read
- This is a 3-bed/2.0-bath other listed at $150k.
- At list price, monthly cash flow is $222 ($3k/yr) — positive.
- The deal already cash-flows at list — no discount required.
- Meets the 1% rule at list price ($2k rent vs $150k).
- Only 3 days on market — expect competitive offers; lowballing is unlikely to land.
- Local home prices are declining (-3.0%/yr); year-one equity from $1k of loan paydown is wiped out by about $4k of value loss. Plan a longer hold.
- Location reads 83/100 on livability (#44 in IL, #902 nationally) — a professional / high-income tenant draw. Strengths: commute A+, cost of living A+, housing A+; Watch: crime F.
- Champaign CUSD 4 (urban): math 24% / reading 26% proficiency, ranked #333 of 620 in IL (top 54%) — low school quality limits family demand, transient renter base, plan for 1-2y turnover.
- Zoned schools: International Prep Academy (math 12% / reading 8%, grade F, #1,517 of 2,056 statewide, top 78%, 568 students, 0% FRL); Jefferson Middle School (math 9% / reading 18%, grade F, #535 of 665 statewide, top 81%, 738 students, 0% FRL); Central High School (math 32% / reading 38%, grade F, #125 of 693 statewide, top 18%, 1,597 students, 0% FRL) — zoned schools average 0% FRL vs 52% district-wide (52 pts lower); this property's tenant base skews higher-income than the district average.
- Watch-outs: property tax is 4.0% of price; built in 1900 — expect roof / HVAC / electrical / plumbing capex.
- Market conditions: Rents rising fast (+4.6%/yr); 51 active listings in the ZIP; 5 comparable units currently listed for rent nearby; rentals at typical pace (median 15d on market — plan ~3-4 weeks tenant-placement turnaround); 40% of comp listings sitting > 30 days — soft ceiling on asking rent; lower-income renter base — watch delinquency; 573 units permitted in Champaign County in 2024 (359 in 5+ unit buildings).
- Champaign County population projected at +15% by 2050 — modest demand growth; plan on rents tracking national, not racing it.
- Cap rate 8.1% vs local median 3.8% in Champaign — top-decile yield for the area; either an underpriced asset or a hidden risk that comps aren't pricing in. Stress-test before assuming the spread holds.
- At $1,986/mo this rent would consume 87% of the median local household income ($28k/yr) (locally 4754% of renters already pay >50% of income on rent) — very limited rent-growth headroom before tenants either downsize or default.
Questions for listing agent
- Built in 1900 — when were the roof, HVAC, electrical panel, plumbing, and water heater last replaced?
- Property tax is high relative to price — has the assessment been appealed recently, and will the sale trigger a re-assessment?
- Is there a deadline driving the sale (1031 exchange, divorce, estate, relocation)? That informs how much negotiation room exists.
- Crime grade is F in this area — have there been break-ins, vandalism, or insurance claims at this property in the last 3 years? What carrier currently insures it and at what premium?
- What's the average days-on-market for RENTAL listings here right now (not sales)? A rising rental-DOM trend means longer vacancies and softer asking-rent achievability than the comps imply.
- What's the recent tenant-quality profile in this submarket — average credit score on applications, eviction rate, late-payment / NSF rate, and stable-employment percentage? A property-management company in the area should have these aggregated.
- How much new for-sale + rental construction is in the pipeline within 1–3 miles? Heavy new supply typically softens prices + rents 12–24 months out; constrained supply supports both.
CashFlowRE · CFR-PDV52P05H81BTG
· Data 5 days ago
cashflowre.app · 2026-05-29