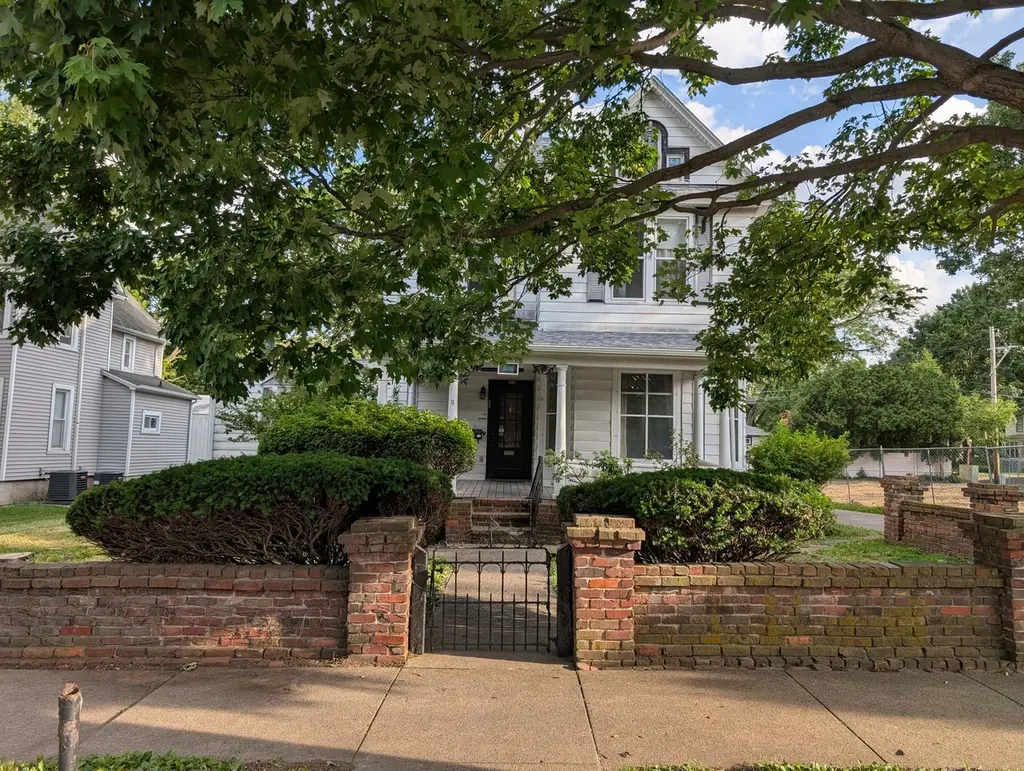
509 W Springfield Ave · Champaign, IL
Flood risk 4/10 · Minor
- FEMA flood zone
- X (unshaded)
- Chance of flooding over 30 yrs
- 0.2%
- Est. flood insurance / yr
- $473 – $860
Fire risk 1/10 · Minimal
- Est. fire insurance / yr
- $804 – $1,492
Heat risk 3/10 · Minor
- Hot days now (above 104°F)
- 7 days/yr
- Hot days in 30 yrs
- 18 days/yr
Wind risk 2/10 · Minimal
- Chance of severe wind over 30 yrs
- 1.0%
Air-quality risk 2/10 · Minimal
- Unhealthy air days now
- 0 days/yr
- Unhealthy air days in 30 yrs
- 1 days/yr
Risk factors via First Street. Map © Google.
Why this score? — see what drove the C grade
The composite is a weighted blend of 9 inputs, each scored 0–100. Each bar is that input's sub-score; the figure is the points it added to the 100-point composite (weight × sub-score).
- Cash flow +21.4/30.0
- 1% rule +8.2/10.0
- ARV discount +7.5/15.0
- DSCR +6.8/10.0
- Livability +4.2/5.0
- Rent growth +3.7/5.0
- Condition / age +2.5/5.0
- Schools +2.2/10.0
- Appreciation +0.0/10.0
$150,000
🖨 Deal sheet 📄 Offer letter ✓ Due diligence
Listing remarks
Handy Man's Dream! This property has Great Potential. Located near Downtown Champaign and the University of Illinois Campus. Wonderful Older Home with Hardwood Floors throughout, Painted Woodwork and Windows, Wallpapering, and Built-Ins. Lots of Charm. 3 Bedrooms and a full Bath (Tub Only) Upstairs and another full Bath on the 1st Floor. 2 Car Detached drive-thru Garage with 2 overhead doors with electric garage door operators. Brick Walls & Pillars and Walkways in the Front and some of the Rear. Brick & paver patios in the Rear. Very Unique! Mostly Fenced Rear Yard with tons of Landscaping and Perennial Beds. Newer Roof, Hot Water Heat Boiler and 200 Amp Electrical Service (Bre
Key facts
- 8,712 sq ft lot
- 2 garage spots
- Listed 3 days
Neighborhood map
What this means for you Summary
Snapshot
- This is a 3-bed/2.0-bath other listed at $150k.
Deal economics
- At list price, monthly cash flow is $222 ($3k/yr) — positive.
- The deal already cash-flows at list — no discount required.
- Meets the 1% rule at list price ($2k rent vs $150k).
- Cap rate 8.1% vs local median 3.8% in Champaign — top-decile yield for the area; either an underpriced asset or a hidden risk that comps aren't pricing in. Stress-test before assuming the spread holds.
Location & tenants
- Location reads 83/100 on livability (#44 in IL, #902 nationally) — a professional / high-income tenant draw. Strengths: commute A+, cost of living A+, housing A+; Watch: crime F.
- Champaign CUSD 4 (urban): math 24% / reading 26% proficiency, ranked #333 of 620 in IL (top 54%) — low school quality limits family demand, transient renter base, plan for 1-2y turnover.
- Zoned schools: Central High School (math 32% / reading 38%, grade F, #125 of 693 statewide, top 18%, 1,597 students, 0% FRL) — zoned schools average 0% FRL vs 52% district-wide (52 pts lower); this property's tenant base skews higher-income than the district average.
- Market conditions: Rents rising fast (+4.6%/yr); 51 active listings in the ZIP; 5 comparable units currently listed for rent nearby; rentals leasing fast (median 14d on market — plan ~1-2 weeks tenant-placement turnaround); 40% of comp listings sitting > 30 days — soft ceiling on asking rent; lower-income renter base — watch delinquency; 573 units permitted in Champaign County in 2024 (359 in 5+ unit buildings).
- At $1,986/mo this rent would consume 87% of the median local household income ($28k/yr) (locally 4754% of renters already pay >50% of income on rent) — very limited rent-growth headroom before tenants either downsize or default.
Forward outlook
- Local home prices are declining (-3.0%/yr); year-one equity from $1k of loan paydown is wiped out by about $4k of value loss. Plan a longer hold.
- Champaign County population projected at +15% by 2050 — modest demand growth; plan on rents tracking national, not racing it.
Negotiation context
- Only 3 days on market — expect competitive offers; lowballing is unlikely to land.
Risks & watch-outs
- Watch-outs: property tax is 4.0% of price; built in 1900 — expect roof / HVAC / electrical / plumbing capex.
Questions for the listing agent
- Built in 1900 — when were the roof, HVAC, electrical panel, plumbing, and water heater last replaced?
- Property tax is high relative to price — has the assessment been appealed recently, and will the sale trigger a re-assessment?
- Is there a deadline driving the sale (1031 exchange, divorce, estate, relocation)? That informs how much negotiation room exists.
- Crime grade is F in this area — have there been break-ins, vandalism, or insurance claims at this property in the last 3 years? What carrier currently insures it and at what premium?
- What's the average days-on-market for RENTAL listings here right now (not sales)? A rising rental-DOM trend means longer vacancies and softer asking-rent achievability than the comps imply.
- What's the recent tenant-quality profile in this submarket — average credit score on applications, eviction rate, late-payment / NSF rate, and stable-employment percentage? A property-management company in the area should have these aggregated.
- How much new for-sale + rental construction is in the pipeline within 1–3 miles? Heavy new supply typically softens prices + rents 12–24 months out; constrained supply supports both.
Investment metrics
- 1% rule
- 1.32% ✓
- Cap rate
- 8.07%
- Cash-on-cash
- 6.35%
- DSCR
- 1.28
- GRM
- 6.3
CMA / ARV
No comps found within radius.
Projected returns pro-forma
-3.0% appreciation · 4.62% rent growth · sell at horizon
- IRR
- -4.1%
- Equity multiple
- 0.84×
- Total profit
- $-6,632
- Equity at exit
- $22,365
- IRR
- 7.8%
- Equity multiple
- 1.65×
- Total profit
- $27,313
- Equity at exit
- $12,969
Cash invested: $42,000 (down + closing). Projections, not guarantees.
Landlord ↔ Tenant lean methodology
- Overall (STATE)
- 43 Moderately Tenant-Leaning
- State Illinois
- 43 Moderately Tenant-Leaning · D+7
- County
- — inherits STATE
- City
- — inherits STATE
ZIP-level market 61820
- Home prices YoY
- -31.9%
- Rents YoY
- 4.6%
- Active inventory
- 51
- Price-to-rent
- 6.3×
Monthly cashflow live
- Estimated rent
- $1,986 medium interval (Pro) →
- Mortgage (P&I)
- −$787
- Tax from tax record
- −$498 /mo · $5,972/yr
- Insurance
- −$62
- HOA
- −$0
- Vacancy / Maint / Mgmt
- −$417
- Net cashflow
- $222
Break-even live
UW: 25.0% down · 7.5% · 30yr · 1.5% tax · 5.0% vac · 8.0% maint · 8.0% mgmt
Financing live
Cash to close
- Down payment
- $37,500
- Closing costs
- $4,500
- Reserves months
- —
- Total cash needed
- —
Loan-product check · same deal, 3 products live
Conventional
25% down · 7.5% · 30yr
- Down + closing
- —
- Monthly P&I
- —
- Monthly cashflow
- —
- DSCR
- —
- Eligible?
- —
Personal DTI + credit; lowest rate.
DSCR
20% down · 8.5% · 30yr
- Down + closing
- —
- Monthly P&I
- —
- Monthly cashflow
- —
- DSCR
- —
- Eligible?
- —
No personal income docs; deal must DSCR.
Hard money
10% down · 12.0% · 12mo
- Down + closing
- —
- Monthly P&I
- —
- Monthly cashflow
- —
- DSCR
- —
- Eligible?
- —
Short-term bridge; refi at stabilization.
Rent comps 5 comps
| Address | Beds | Baths | Sqft | Rent | $/sqft | DOM | Units | Dist |
|---|---|---|---|---|---|---|---|---|
| 806 W Hill St Champaign, IL | 4.0 | 3.0 | 2400 | $2,800 | $1.17 | 13d | 1 | 0.59mi |
| 707 Hessel Blvd Champaign, IL | 3.0 | 2.0 | 1967 | $1,930 | $0.98 | 43d | 1 | 0.68mi |
| 132 E University Ave Champaign, IL | 4.0 | 4.0 | 2000 | $825 | $0.41 | 13d | 1 | 0.79mi |
| 1320 Alms Dr Champaign, IL | 3.0 | 1.0 | 1400 | $1,750 | $1.25 | 13d | 1 | 0.83mi |
| 1738 Westhaven Dr Champaign, IL | 4.0 | 3.5 | 2810 | $2,100 | $0.75 | 43d | 1 | 1.19mi |
Listing history 5 events
-
2026-06-13statusdays on market $150,000 Pending 3 DOM
-
2026-06-10days on market $150,000 Active 2 DOM
-
2026-06-09status $150,000 Active 1 DOM
-
2026-06-09remarks 691-char remark
-
2026-06-09$150,000 Active (Private) 1 DOM
ⓘ Source: listings_history table (triggers on properties + properties_extension) + one-shot
backfill from property_details.listing_events for pre-trigger history.
Tax reassessment forecast IL · Partial reset (capped growth)
- Current annual tax
- $5,972 · $498/mo
- Projected year-2 tax
- $5,972 · $498/mo
- Expected delta
- $0/yr ($0/mo · 0.0%)
ⓘ Screening estimate from a state-policy table — verify with the county assessor before closing.
Climate risk First Street
- Flood 4/10 Moderate FEMA zone X (unshaded) · 20% chance over 30 yrs
- Wildfire 1/10 Low
- Heat 3/10 Moderate 7 d/yr ≥104°F today · 18 d/yr by 30 yrs out
- Wind 2/10 Low 100% chance of damaging wind over 30 yrs
- Air quality 2/10 Low 0 unhealthy d/yr today · 1 by 30 yrs out
Nearby sold comps map
Loading sold comps map…
Walkable amenities ~0.75 mi
Loading nearby amenities…
Taxation est. · year 1
- Rental income
- $23,835
- − Mortgage interest
- −$8,402
- − Property taxes
- −$5,972
- − Insurance
- −$750
- − Repairs & maintenance
- −$1,907
- − Management
- −$1,907
- − Depreciation
- −$4,364
- Taxable income
- $534
- Est. tax owed @ 24.0%
- −$128
- After-tax cash flow
- $2,541/yr
For passive investors: Depreciation is non-cash, so a rental often shows a tax loss while cash-flowing — sheltering income. Rental losses are passive: they offset passive income freely, and up to $25,000/yr can offset ordinary (W-2) income if you actively participate and your MAGI is under $100k (phasing out to $0 by $150k); unused losses carry forward. On sale, claimed depreciation is recaptured at up to 25%, and gains may owe capital-gains tax (a 1031 exchange can defer both). Figures are a year-1 estimate at your 24.0% rate — not tax advice; consult a CPA.
Schools (NCES district)
- District
- Champaign CUSD 4
- NCES district ID
- 1709420
- Math proficiency
- 24% ▼ -7.00%
- Reading proficiency
- 26% ▼ -7.00%
- Median HH income
- $45,797
- Composite
- 21.66/100
- National rank
- #8281
- State rank
- #333 of 620 in IL
Livability — Champaign
- Score
- 83/100
- State rank
- #44
- US rank
- #902
Category grades
Schools grade is shown separately in the Schools card above.
Census & demographics
- Census place
- Champaign, IL
- County
- Champaign County · 182,148 people
- City population
- 96,852
- Metro
- Champaign-Urbana, IL
- Population (ZIP)
- 40,599
- Household income
- $27,539
- Rent vs Own
- Severe rent burden
- 4754.0
Population outlook (Champaign County) Hauer SSP2
- Today (2025)
- 223,848 people
- By 2030
- 231,416 · +3.4%
- By 2040
- 244,321 · +9.1%
- By 2050
- 256,432 · +14.6%
- By 2075
- 285,823 · +27.7%
- By 2100
- 296,406 · +32.4%
Race, ethnicity, and origin ACS 2023
- Neighborhood character
- Diverse neighborhood (Simpson 0.62)
- Race & ethnicity
- White 57% Asian 18% Black 13% Hispanic / Latino 9% Two or more races 8%
- Hispanic origin (detail)
- Mexican 6%
- Common ancestry
- Romanian 4% Italian 2% Lithuanian 1%
- Foreign-born
- 17% · China, Canada, South Korea
- Languages at home
- 74% English-only · Chinese 7% Spanish 6% Other Indo-European 5%
Political lean MEDSL · Champaign
- 2024 margin
- Strong D (+24.1) · D 61.3% · R 37.2% · Other 1.5%
- 2008→2024 swing
- +6.6pp toward D · 2008: 17.5pp · 2024: 24.1pp
- All cycles
- 2024: D+24.1 2020: D+22.8 2016: D+18.4 2012: D+6.8 2008: D+17.5
Not yet ingested
- Civics
- —
Market trends
- HPI YoY
- ▼ -112.24%
- Current HPI
- 239.5835
- Rent YoY
- ▲ 4.62%
- Metro
- Champaign-Urbana, IL
- State GDP YoY
- ▲ 1.59%
- F500 in state
- 60
Industry mix (Fortune 500 HQ in IL)
| Industry | F500 HQs | Revenue |
|---|---|---|
| Insurance | 4 | $201B |
|
||
| Consumer Goods | 4 | $87B |
|
||
| Industrial Machinery | 3 | $64B |
|
||
| Healthcare | 2 | $55B |
|
||
| Retail / Pharmacy | 1 | $148B |
|
||
| Agriculture / Food | 1 | $86B |
|
||
Price history
1 event — show timeline
- 2026-06-08 Coming Soon $150,000 MRED as Distributed by MLS Grid
Property tax history
+5.1%/yrLatest (2024): $5,972 · +7.1% YoY. Source: county tax records.
Cash-flow waterfall
monthlySold comps — $/sqft
last 12 mo · ≤1 miLoading sold comps…