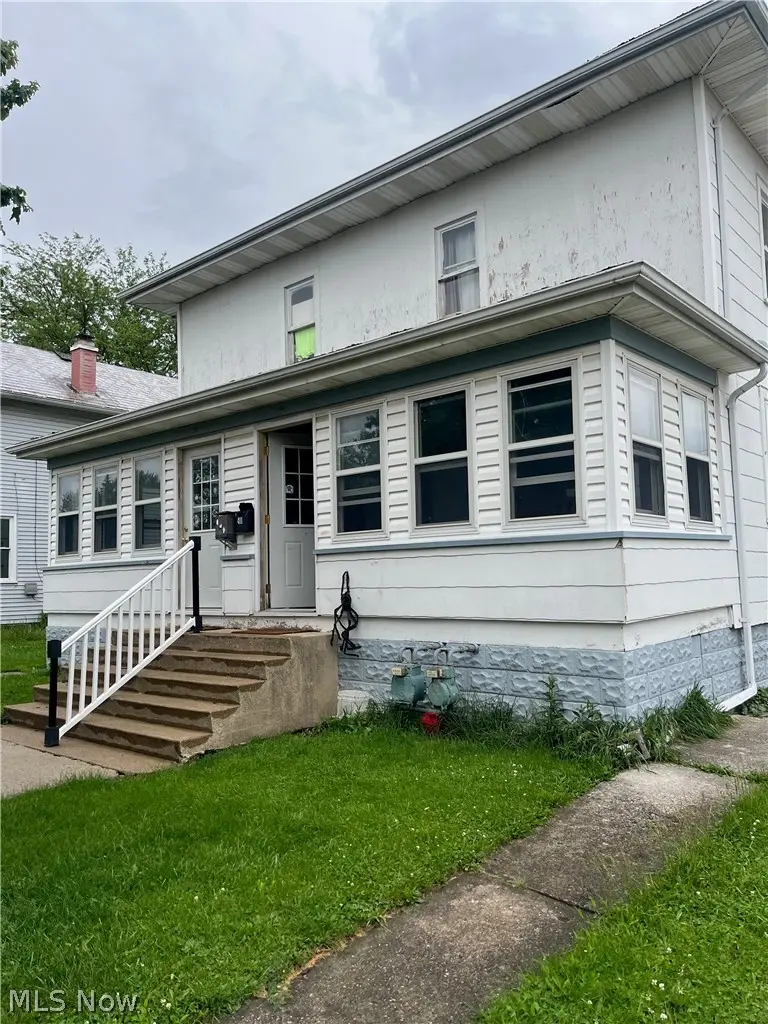
411 S Myrtle Ave
Willard, OH 44890
$60,000B-
3 bd · 3.0 ba ·
2,760 sqft ·
Built 1995
· MultiFamily
· Pending
· 17 DOM
Cashflow @ list (25.0% down · 7.5%)
Estimated rent
$2,236/mo
Mortgage (P&I)
−$315
Tax + insurance
−$74
HOA
−$0
Vac / Maint / Mgmt
−$470
Net cashflow
$1,378/mo
Annual
$16,533/yr
Cap rate
33.85%
Cash-on-cash
98.41%
DSCR
5.38
1% rule
3.73%
Cash to close
$16,800
Investor read
- This is a 2 × 3-bed/2.5-bath units multifamily listed at $60k.
- At list price, monthly cash flow is $1k ($17k/yr) — positive. Per door: $689/mo.
- The deal already cash-flows at list — no discount required.
- Meets the 1% rule at list price ($2k rent vs $60k).
- It's been on market 17 days — a 2% lower offer ($59k) is reasonable based on typical stale-listing flexibility.
- Recommended offer: $59k (1.5% below list) — sets the bar for market timing.
- Local home prices are declining (-3.0%/yr); year-one equity from $415 of loan paydown is wiped out by about $2k of value loss. Plan a longer hold.
- Location reads 70/100 on livability (#469 in OH) — a middle-class / working-renter tenant base. Strengths: cost of living A+, housing A+, health & safety A+; Watch: schools D+, employment D+, amenities F.
- Willard City (town): math 38% / reading 49% proficiency, ranked #505 of 656 in OH (top 77%) — families likely to look elsewhere, expect single-tenant / working-renter base with shorter leases.
- Market conditions: 57 active listings in the ZIP; 40 units permitted in Huron County in 2024 (0 in 5+ unit buildings).
- Huron County population projected at -22% by 2050 — secular population decline; favor cash flow + early exit over multi-decade hold.
- At projected returns (-3.0% appreciation + 3.0% rent growth), your $17k cash investment doubles in ~2 years — after that, you're playing with house money.
- Climate carrying-cost: moderate flood risk — expect insurance premiums to compound above CPI over the hold.
- Cap rate 33.8% vs local median 3.6% in Willard — top-decile yield for the area; either an underpriced asset or a hidden risk that comps aren't pricing in. Stress-test before assuming the spread holds.
- This rent runs 41% of the median local income ($65k/yr) — at the standard rent-burdened threshold; future hikes will face affordability resistance.
Questions for listing agent
- Can we see the unit-by-unit rent roll, current vacancy, and any below-market leases? What's the average tenancy length?
- What capital expenditures (roof, boiler, parking lot, exteriors) have been made in the last 5 years, and what's planned in the next 2?
- Is there a deadline driving the sale (1031 exchange, divorce, estate, relocation)? That informs how much negotiation room exists.
- Schools are D-rated, which usually means shorter tenancies and higher turnover. Who's the typical renter profile here, and what's been the actual vacancy rate?
- What's the average days-on-market for RENTAL listings here right now (not sales)? A rising rental-DOM trend means longer vacancies and softer asking-rent achievability than the comps imply.
- What's the recent tenant-quality profile in this submarket — average credit score on applications, eviction rate, late-payment / NSF rate, and stable-employment percentage? A property-management company in the area should have these aggregated.
- How much new apartment / multifamily construction is in the pipeline within 1–3 miles? Heavy new supply (>2% of stock underway) typically softens rents 12–24 months out; light construction supports rent growth.
CashFlowRE · CFR-PDVP3N44586TP1
· Data 1 week ago
cashflowre.app · 2026-05-29