 Duplex
411 S Myrtle Ave · Willard, OH
Flood risk 5/10 · Moderate
- FEMA flood zone
- X (unshaded)
- Chance of flooding over 30 yrs
- 0.49%
- Est. flood insurance / yr
- $473 – $860
Fire risk 1/10 · Minimal
- Est. fire insurance / yr
- $713 – $1,323
Heat risk 3/10 · Minor
- Hot days now (above 98°F)
- 7 days/yr
- Hot days in 30 yrs
- 16 days/yr
Wind risk 1/10 · Minimal
- Chance of severe wind over 30 yrs
- —
Air-quality risk 2/10 · Minimal
- Unhealthy air days now
- 0 days/yr
- Unhealthy air days in 30 yrs
- 1 days/yr
Risk factors via First Street. Map © Google.
Why this score? — see what drove the B- grade
The composite is a weighted blend of 9 inputs, each scored 0–100. Each bar is that input's sub-score; the figure is the points it added to the 100-point composite (weight × sub-score).
- Cash flow +30.0/30.0
- 1% rule +10.0/10.0
- DSCR +10.0/10.0
- ARV discount +7.5/15.0
- Schools +3.7/10.0
- Livability +3.5/5.0
- Rent growth +2.5/5.0
- Condition / age +2.5/5.0
- Appreciation +0.0/10.0
$60,000
🖨 Deal sheet 📄 Offer letter ✓ Due diligence
Multi-family units
County records classify this as Multi-Family (2-4 Unit). Listing-text estimate: 2 units. confirmed
Listing remarks
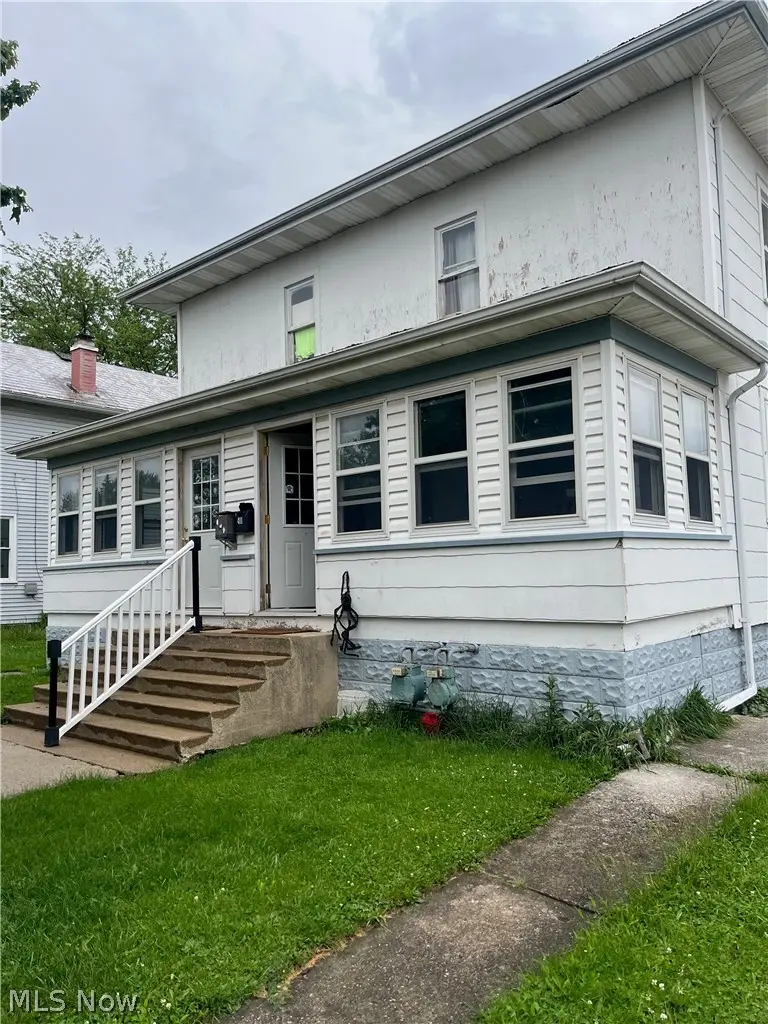
Investor opportunity in the heart of Willard! This side-by-side duplex at 411 S Myrtle Ave offers strong potential for the right buyer ready to bring it back to life. Both upstairs units have been gutted and are ready for renovation, giving investors a blank slate to add value and maximize rental income. One side features a newer furnace system installed in the basement. Property is conveniently located within walking distance to local schools, shopping, and downtown amenities. Ideal for seasoned investors, flippers, or landlords looking for their next project.
Key facts
- Side-by-side duplex
- Newer furnace system
- 9,513 sq ft lot
Tags
Property features AI
Exterior
- Parking: Attached garage with 2 spaces; Driveway parking
- Utilities: Public water; Public sewer
- Home design: 2-story home; Property listed as fixer condition
- Construction: Wood siding exterior; Asphalt roof; Built per public records
- Exterior features: Driveway
Interior
- Bedrooms: Total of 9 rooms (bedroom count not specified)
- Bathrooms: 2 full bathrooms; 1 half bathroom
- Heating & cooling: Hot water heating; Steam heating
- Interior features: Basement with bath rough-in/stubbed
Neighborhood map
What this means for you Summary
Snapshot
- This is a 2 × 3-bed/2.5-bath units multifamily listed at $60k.
Deal economics
- At list price, monthly cash flow is $1k ($17k/yr) — positive. Per door: $689/mo.
- The deal already cash-flows at list — no discount required.
- Meets the 1% rule at list price ($2k rent vs $60k).
- Recommended offer: $59k (1.5% below list) — sets the bar for market timing.
- Cap rate 33.8% vs local median 3.6% in Willard — top-decile yield for the area; either an underpriced asset or a hidden risk that comps aren't pricing in. Stress-test before assuming the spread holds.
Location & tenants
- Location reads 70/100 on livability (#469 in OH) — a middle-class / working-renter tenant base. Strengths: cost of living A+, housing A+, health & safety A+; Watch: schools D+, employment D+, amenities F.
- Willard City (town): math 38% / reading 49% proficiency, ranked #505 of 656 in OH (top 77%) — families likely to look elsewhere, expect single-tenant / working-renter base with shorter leases.
- Market conditions: 57 active listings in the ZIP; 40 units permitted in Huron County in 2024 (0 in 5+ unit buildings).
- This rent runs 41% of the median local income ($65k/yr) — at the standard rent-burdened threshold; future hikes will face affordability resistance.
Forward outlook
- Local home prices are declining (-3.0%/yr); year-one equity from $415 of loan paydown is wiped out by about $2k of value loss. Plan a longer hold.
- Huron County population projected at -22% by 2050 — secular population decline; favor cash flow + early exit over multi-decade hold.
- At projected returns (-3.0% appreciation + 3.0% rent growth), your $17k cash investment doubles in ~2 years — after that, you're playing with house money.
Negotiation context
- It's been on market 17 days — a 2% lower offer ($59k) is reasonable based on typical stale-listing flexibility.
Risks & watch-outs
- Climate carrying-cost: moderate flood risk — expect insurance premiums to compound above CPI over the hold.
Questions for the listing agent
- Can we see the unit-by-unit rent roll, current vacancy, and any below-market leases? What's the average tenancy length?
- What capital expenditures (roof, boiler, parking lot, exteriors) have been made in the last 5 years, and what's planned in the next 2?
- Is there a deadline driving the sale (1031 exchange, divorce, estate, relocation)? That informs how much negotiation room exists.
- Schools are D-rated, which usually means shorter tenancies and higher turnover. Who's the typical renter profile here, and what's been the actual vacancy rate?
- What's the average days-on-market for RENTAL listings here right now (not sales)? A rising rental-DOM trend means longer vacancies and softer asking-rent achievability than the comps imply.
- What's the recent tenant-quality profile in this submarket — average credit score on applications, eviction rate, late-payment / NSF rate, and stable-employment percentage? A property-management company in the area should have these aggregated.
- How much new apartment / multifamily construction is in the pipeline within 1–3 miles? Heavy new supply (>2% of stock underway) typically softens rents 12–24 months out; light construction supports rent growth.
Investment metrics
- 1% rule
- 3.73% ✓
- Cap rate
- 33.85%
- Cash-on-cash
- 98.41%
- DSCR
- 5.38
- GRM
- 2.2
CMA / ARV
No comps found within radius.
Projected returns pro-forma
-3.0% appreciation · 3.0% rent growth · sell at horizon
- IRR
- 99.4%
- Equity multiple
- 5.65×
- Total profit
- $78,046
- Equity at exit
- $8,946
- IRR
- —
- Equity multiple
- 11.78×
- Total profit
- $181,027
- Equity at exit
- $5,188
Cash invested: $16,800 (down + closing). Projections, not guarantees.
Landlord ↔ Tenant lean methodology
- Overall (STATE)
- 73 Landlord-Friendly
- State Ohio
- 73 Landlord-Friendly · R+6
- County
- — inherits STATE
- City
- — inherits STATE
ZIP-level market 44890
- Home prices YoY
- -16.2%
- Active inventory
- 57
- Price-to-rent
- 4.5×
Monthly cashflow live
- Estimated rent
- $2,236 medium interval (Pro) →
- Mortgage (P&I)
- −$315
- Tax from tax record
- −$49 /mo · $588/yr
- Insurance
- −$25
- HOA
- −$0
- Vacancy / Maint / Mgmt
- −$470
- Net cashflow
- $1,378
Break-even live
2-unit breakdown (identical units grouped — click to expand)
| Units | Beds | Baths | Est. rent |
|---|---|---|---|
| 2× units | 3 | 2.5 | $2,236 |
| #1 | 3 | 2.5 | $1,118 |
| #2 | 3 | 2.5 | $1,118 |
| Total (2 units) | $2,236 | ||
UW: 25.0% down · 7.5% · 30yr · 1.5% tax · 5.0% vac · 8.0% maint · 8.0% mgmt
Financing live
Cash to close
- Down payment
- $15,000
- Closing costs
- $1,800
- Reserves months
- —
- Total cash needed
- —
Loan-product check · same deal, 3 products live
Conventional
25% down · 7.5% · 30yr
- Down + closing
- —
- Monthly P&I
- —
- Monthly cashflow
- —
- DSCR
- —
- Eligible?
- —
Personal DTI + credit; lowest rate.
DSCR
20% down · 8.5% · 30yr
- Down + closing
- —
- Monthly P&I
- —
- Monthly cashflow
- —
- DSCR
- —
- Eligible?
- —
No personal income docs; deal must DSCR.
Hard money
10% down · 12.0% · 12mo
- Down + closing
- —
- Monthly P&I
- —
- Monthly cashflow
- —
- DSCR
- —
- Eligible?
- —
Short-term bridge; refi at stabilization.
Listing history 11 events
-
2026-06-12statusdays on market $60,000 Pending 17 DOM
-
2026-06-09days on market $60,000 Active 16 DOM
-
2026-06-08days on market $60,000 Active 15 DOM
-
2026-06-08days on market $60,000 Active 14 DOM
-
2026-06-07days on market $60,000 Active 13 DOM
-
2026-06-04days on market $60,000 Active 10 DOM
-
2026-06-02days on market $60,000 Active 9 DOM
-
2026-06-01days on market $60,000 Active 8 DOM
-
2026-05-31days on market $60,000 Active 7 DOM
-
2026-05-22$70,000 Active
-
1994-05-02soldstatus $63,000
ⓘ Source: listings_history table (triggers on properties + properties_extension) + one-shot
backfill from property_details.listing_events for pre-trigger history.
Tax reassessment forecast OH · Partial reset (capped growth)
- Current annual tax
- $588 · $49/mo
- Projected year-2 tax
- $762 · $64/mo
- Expected delta
- +$174/yr (+$14/mo · 29.6%)
ⓘ Screening estimate from a state-policy table — verify with the county assessor before closing.
Climate risk First Street
- Flood 5/10 Major FEMA zone X (unshaded) · 49% chance over 30 yrs
- Wildfire 1/10 Low
- Heat 3/10 Moderate 7 d/yr ≥98°F today · 16 d/yr by 30 yrs out
- Wind 1/10 Low
- Air quality 2/10 Low 0 unhealthy d/yr today · 1 by 30 yrs out
Nearby sold comps map
Loading sold comps map…
Walkable amenities ~0.75 mi
Loading nearby amenities…
Taxation est. · year 1
- Rental income
- $26,832
- − Mortgage interest
- −$3,361
- − Property taxes
- −$588
- − Insurance
- −$300
- − Repairs & maintenance
- −$2,147
- − Management
- −$2,147
- − Depreciation
- −$1,745
- Taxable income
- $16,544
- Est. tax owed @ 24.0%
- −$3,971
- After-tax cash flow
- $12,563/yr
For passive investors: Depreciation is non-cash, so a rental often shows a tax loss while cash-flowing — sheltering income. Rental losses are passive: they offset passive income freely, and up to $25,000/yr can offset ordinary (W-2) income if you actively participate and your MAGI is under $100k (phasing out to $0 by $150k); unused losses carry forward. On sale, claimed depreciation is recaptured at up to 25%, and gains may owe capital-gains tax (a 1031 exchange can defer both). Figures are a year-1 estimate at your 24.0% rate — not tax advice; consult a CPA.
Schools (NCES district)
- District
- Willard City
- NCES district ID
- 3904509
- Math proficiency
- 38% ▼ -14.00%
- Reading proficiency
- 49% ▼ -7.00%
- Median HH income
- $46,675
- Composite
- 37.04/100
- National rank
- #4512
- State rank
- #505 of 656 in OH
Livability — Willard
- Score
- 70/100
- State rank
- #469
- US rank
- #7772
Category grades
Schools grade is shown separately in the Schools card above.
Census & demographics
- Census place
- Willard, OH
- County
- Huron · 56,496 people
- Population (ZIP)
- 10,364
- Household income
- $64,971
- Rent vs Own
- Severe rent burden
- 5.8
Population outlook (Huron County) Hauer SSP2
- Today (2025)
- 55,572 people
- By 2030
- 53,514 · -3.7%
- By 2040
- 48,770 · -12.2%
- By 2050
- 43,611 · -21.5%
- By 2075
- 32,349 · -41.8%
- By 2100
- 21,849 · -60.7%
Race, ethnicity, and origin ACS 2023
- Neighborhood character
- Predominantly White (83%)
- Race & ethnicity
- White 83% Hispanic / Latino 13% Two or more races 4%
- Hispanic origin (detail)
- Mexican 9% Puerto Rican 2%
- Common ancestry
- Iranian 3% Slovak 1% Lithuanian 1%
- Foreign-born
- 3% · Canada
- Languages at home
- 92% English-only · Spanish 6% German/W. Germanic 1%
Political lean MEDSL · Huron
- 2024 margin
- Solid R (+44.0) · D 27.6% · R 71.6%
- 2008→2024 swing
- -40.9pp toward R · 2008: -3.1pp · 2024: -44.0pp
- All cycles
- 2024: R+44.0 2020: R+41.2 2016: R+36.4 2012: R+8.9 2008: R+3.1
Not yet ingested
- Civics
- —
Market trends
- HPI YoY
- ▼ -44.45%
- Current HPI
- 229.9428
- Rent YoY
- —
- Metro
- —
- State GDP YoY
- ▲ 1.98%
- F500 in state
- 48
Industry mix (Fortune 500 HQ in OH)
| Industry | F500 HQs | Revenue |
|---|---|---|
| Insurance | 3 | $145B |
|
||
| Industrial Machinery | 3 | $49B |
|
||
| Financial Services | 3 | $24B |
|
||
| Consumer Goods | 2 | $93B |
|
||
| Aerospace / Defense | 2 | $47B |
|
||
| Utilities | 2 | $33B |
|
||
Price history
+11.1% since first listed2 events — show timeline
- 2026-05-22 Listed $70,000 MLSNOW
- 1994-05-02 Sold (Public Records) $63,000 Public Records
Property tax history
-4.9%/yrLatest (2025): $588 · +0.8% YoY. Source: county tax records.
Cash-flow waterfall
monthlySold comps — $/sqft
last 12 mo · ≤1 miLoading sold comps…