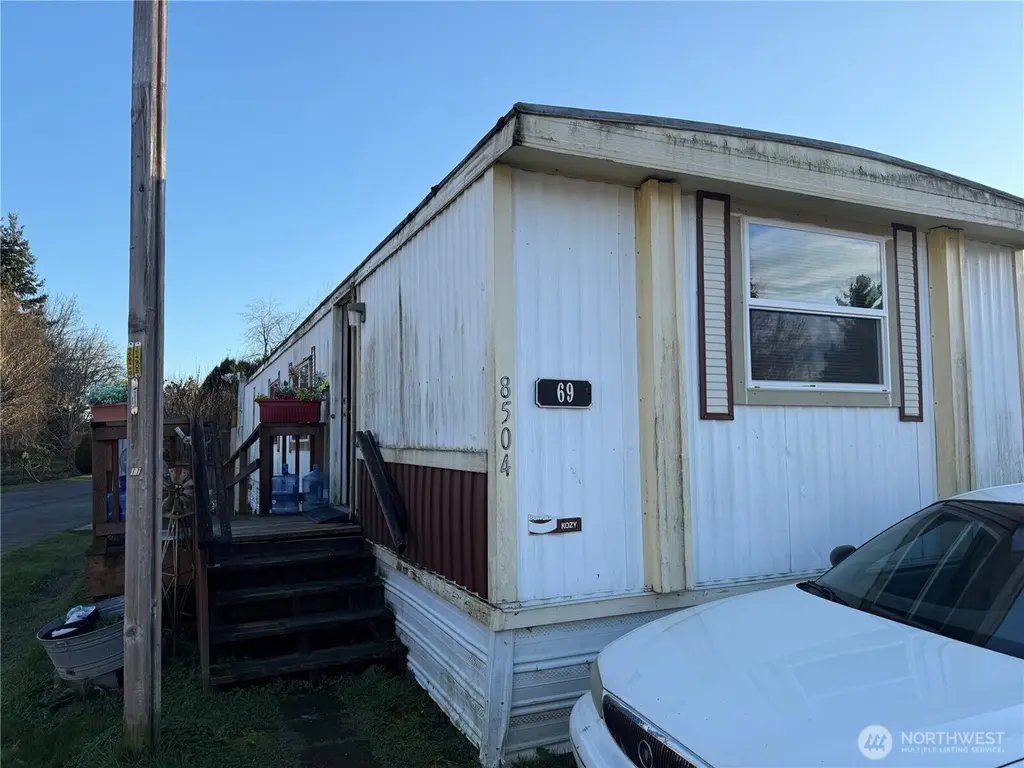
8504 37th Street Ct E #69
Edgewood, WA 98371
$29,950C-
3 bd · 1.0 ba ·
784 sqft ·
Built 1979
· Manufactured
· Active
· 126 DOM
Cashflow @ list (25.0% down · 7.5%)
Estimated rent
$2,201/mo
Mortgage (P&I)
−$157
Tax + insurance
−$455
HOA
−$0
Vac / Maint / Mgmt
−$462
Net cashflow
$1,127/mo
Annual
$13,520/yr
Cap rate
68.53%
Cash-on-cash
222.26%
DSCR
10.89
1% rule
7.35%
Cash to close
$8,386
Investor read
- This is a 3-bed/1.0-bath manufactured listed at $30k.
- At list price, monthly cash flow is $1k ($14k/yr) — positive.
- The deal already cash-flows at list — no discount required.
- Meets the 1% rule at list price ($2k rent vs $30k).
- It's been on market 126 days — a 12% lower offer ($26k) is reasonable based on typical stale-listing flexibility.
- Recommended offer: $26k (12.0% below list) — sets the bar for market timing.
- Local home prices are declining (-3.0%/yr); year-one equity from $208 of loan paydown is wiped out by about $898 of value loss. Plan a longer hold.
- Location reads 80/100 on livability (#95 in WA, #1,861 nationally) — a professional / high-income tenant draw. Strengths: employment A+, housing A+, commute A; Watch: amenities F, cost of living F.
- Puyallup School District (suburban): math 53% / reading 66% proficiency, ranked #52 of 291 in WA (top 18%) — acceptable for families but not a draw, mixed tenant base, ~2y average lease.
- Watch-outs: flood insurance adds $427/mo.
- Market conditions: Rents rising (+1.4%/yr); 227 active listings in the ZIP; 9 comparable units currently listed for rent nearby; rentals at typical pace (median 16d on market — plan ~3-4 weeks tenant-placement turnaround); solid renter incomes; 3,209 units permitted in Pierce County in 2024 (1,269 in 5+ unit buildings).
- Pierce County population projected at +26% by 2050 — long-run rental-demand tailwind backs the buy-and-hold thesis.
- At projected returns (-3.0% appreciation + 1.4% rent growth), your $8k cash investment doubles in ~1 year — after that, you're playing with house money.
- Climate carrying-cost: in FEMA flood zone AE (mandatory federal flood insurance) — expect insurance premiums to compound above CPI over the hold.
- Cap rate 68.5% vs local median 1.9% in Edgewood — top-decile yield for the area; either an underpriced asset or a hidden risk that comps aren't pricing in. Stress-test before assuming the spread holds.
Questions for listing agent
- It's been on market 126 days. Have you received any prior offers? Is the seller open to a 12% concession, seller financing, or rate buy-down credit?
- Built in 1979 — when were the roof, HVAC, electrical panel, plumbing, and water heater last replaced?
- What's the actual annual flood-insurance premium (NFIP or private), and is the property in a SFHA with mandatory coverage?
- Why hasn't it sold? Are there any deal-killer items the seller is aware of (foundation, flood, title, zoning, code violations)?
- Is there a deadline driving the sale (1031 exchange, divorce, estate, relocation)? That informs how much negotiation room exists.
- Schools are A-rated — typically a magnet for longer-tenancy family renters. What's the average tenant stay here, and is there a school-zone premium baked into asking?
- What's the average days-on-market for RENTAL listings here right now (not sales)? A rising rental-DOM trend means longer vacancies and softer asking-rent achievability than the comps imply.
- What's the recent tenant-quality profile in this submarket — average credit score on applications, eviction rate, late-payment / NSF rate, and stable-employment percentage? A property-management company in the area should have these aggregated.
CashFlowRE · CFR-PF0TENEFAPNPYW
· Data 2 days ago
cashflowre.app · 2026-05-29