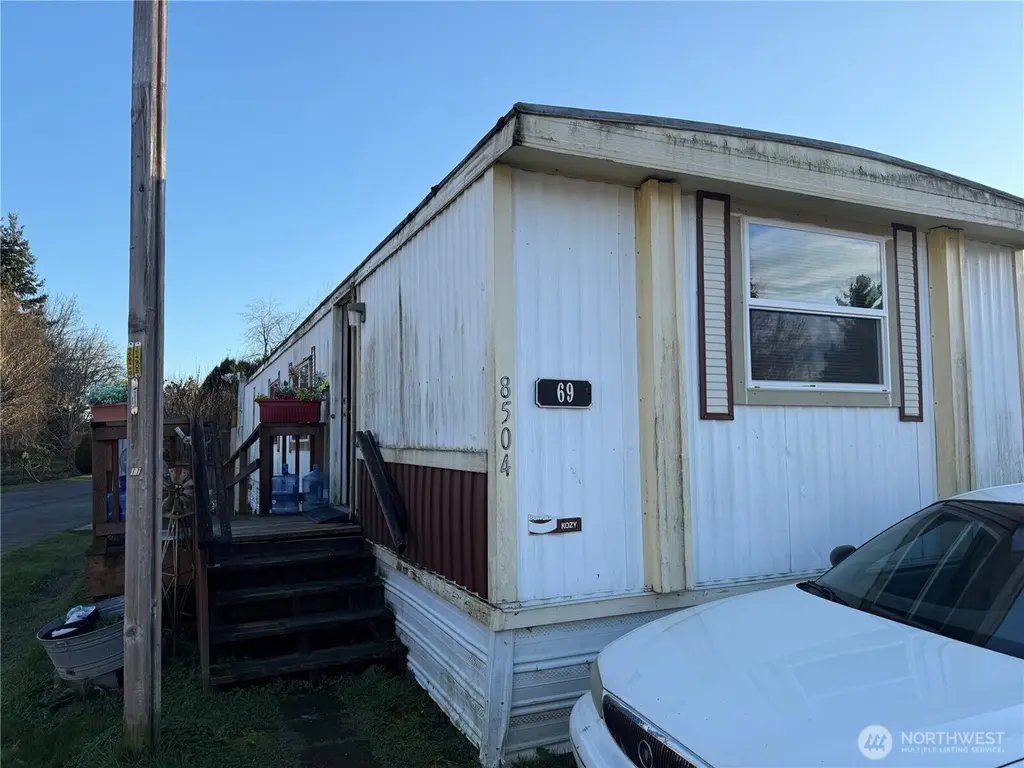
8504 37th Street Ct E #69 · Edgewood, WA
Flood risk 5/10 · Moderate
- FEMA flood zone
- AE
- Chance of flooding over 30 yrs
- 0.64%
- Est. flood insurance / yr
- $1,737 – $8,500
Fire risk 1/10 · Minimal
- Est. fire insurance / yr
- $604 – $1,122
Heat risk 3/10 · Minor
- Hot days now (above 89°F)
- 7 days/yr
- Hot days in 30 yrs
- 15 days/yr
Wind risk 1/10 · Minimal
- Chance of severe wind over 30 yrs
- —
Air-quality risk 7/10 · Major
- Unhealthy air days now
- 11 days/yr
- Unhealthy air days in 30 yrs
- 12 days/yr
Risk factors via First Street. Map © Google.
Why this score? — see what drove the C- grade
The composite is a weighted blend of 9 inputs, each scored 0–100. Each bar is that input's sub-score; the figure is the points it added to the 100-point composite (weight × sub-score).
- Cash flow +15.0/30.0
- ARV discount +15.0/15.0
- Schools +5.4/10.0
- 1% rule +5.0/10.0
- DSCR +5.0/10.0
- Livability +4.0/5.0
- Rent growth +2.9/5.0
- Condition / age +2.5/5.0
- Appreciation +0.0/10.0
$29,950
🖨 Deal sheet 📄 Offer letter ✓ Due diligence
Listing remarks
Opportunity awaits in Cherrywood Mobile Manor! This home is being sold AS-IS and is ready for your vision and improvements. Featuring new windows in the living room and kitchen, accessibility ramps on both sides of the home, and a fully fenced lot offering added privacy and space. Covered entry and off-street parking included. Located in a peaceful community with a charming creek running through the park, creating a serene setting. Ideal for investors, flippers, or buyers looking for an affordable project with upside potential. Bring your tools and imagination!
Key facts
- Covered entry
- Fully fenced lot
- Off-street parking
Tags
Neighborhood map
What this means for you Summary
Snapshot
- This is a 3-bed/1.0-bath manufactured listed at $30k.
Deal economics
- At list price, monthly cash flow is $1k ($14k/yr) — positive.
- The deal already cash-flows at list — no discount required.
- Meets the 1% rule at list price ($2k rent vs $30k).
- Recommended offer: $26k (12.0% below list) — sets the bar for market timing.
- Cap rate 68.5% vs local median 1.9% in Edgewood — top-decile yield for the area; either an underpriced asset or a hidden risk that comps aren't pricing in. Stress-test before assuming the spread holds.
Location & tenants
- Location reads 80/100 on livability (#95 in WA, #1,861 nationally) — a professional / high-income tenant draw. Strengths: employment A+, housing A+, commute A; Watch: amenities F, cost of living F.
- Puyallup School District (suburban): math 53% / reading 66% proficiency, ranked #52 of 291 in WA (top 18%) — acceptable for families but not a draw, mixed tenant base, ~2y average lease.
- Market conditions: Rents rising (+1.4%/yr); 227 active listings in the ZIP; 9 comparable units currently listed for rent nearby; rentals at typical pace (median 15d on market — plan ~3-4 weeks tenant-placement turnaround); solid renter incomes; 3,209 units permitted in Pierce County in 2024 (1,269 in 5+ unit buildings).
Forward outlook
- Local home prices are declining (-3.0%/yr); year-one equity from $208 of loan paydown is wiped out by about $898 of value loss. Plan a longer hold.
- Pierce County population projected at +26% by 2050 — long-run rental-demand tailwind backs the buy-and-hold thesis.
- At projected returns (-3.0% appreciation + 1.4% rent growth), your $8k cash investment doubles in ~1 year — after that, you're playing with house money.
Negotiation context
- It's been on market 126 days — a 12% lower offer ($26k) is reasonable based on typical stale-listing flexibility.
Risks & watch-outs
- Watch-outs: flood insurance adds $427/mo.
- Climate carrying-cost: in FEMA flood zone AE (mandatory federal flood insurance) — expect insurance premiums to compound above CPI over the hold.
Questions for the listing agent
- It's been on market 126 days. Have you received any prior offers? Is the seller open to a 12% concession, seller financing, or rate buy-down credit?
- Built in 1979 — when were the roof, HVAC, electrical panel, plumbing, and water heater last replaced?
- What's the actual annual flood-insurance premium (NFIP or private), and is the property in a SFHA with mandatory coverage?
- Why hasn't it sold? Are there any deal-killer items the seller is aware of (foundation, flood, title, zoning, code violations)?
- Is there a deadline driving the sale (1031 exchange, divorce, estate, relocation)? That informs how much negotiation room exists.
- Schools are A-rated — typically a magnet for longer-tenancy family renters. What's the average tenant stay here, and is there a school-zone premium baked into asking?
- What's the average days-on-market for RENTAL listings here right now (not sales)? A rising rental-DOM trend means longer vacancies and softer asking-rent achievability than the comps imply.
- What's the recent tenant-quality profile in this submarket — average credit score on applications, eviction rate, late-payment / NSF rate, and stable-employment percentage? A property-management company in the area should have these aggregated.
- How much new for-sale + rental construction is in the pipeline within 1–3 miles? Heavy new supply typically softens prices + rents 12–24 months out; constrained supply supports both.
Investment metrics
- 1% rule
- 7.35% ✓
- Cap rate
- 68.53%
- Cash-on-cash
- 222.26%
- DSCR
- 10.89
- GRM
- 1.1
CMA / ARV
- ARV (median comp)
- $55,337
- List price
- $29,950
- Delta
- -45.88%
- Verdict
- UNDERPRICED
- Comps
- 7 within 1.0 mi
Show comp detail 1 sale within ~0.75 mi
| Address | Dist | Beds/Ba | Sqft | Sold | Price | $/sf | Match |
|---|---|---|---|---|---|---|---|
| 8406 37th Street Ct E #39 | 0.07mi | 2/1.0 (-1) | 800 (+2%) | 2mo | $65,000 | $81 | 87 |
Match score weights: distance 35% · size 25% · config 20% · recency 20%. Top-matched comps best support the ARV.
Projected returns pro-forma
-3.0% appreciation · 1.41% rent growth · sell at horizon
- IRR
- —
- Equity multiple
- 8.60×
- Total profit
- $63,722
- Equity at exit
- $4,466
- IRR
- —
- Equity multiple
- 17.13×
- Total profit
- $135,260
- Equity at exit
- $2,590
Cash invested: $8,386 (down + closing). Projections, not guarantees.
Landlord ↔ Tenant lean methodology
- Overall (STATE)
- 28 Tenant-Leaning
- State Washington
- 28 Tenant-Leaning · D+8
- County
- — inherits STATE
- City
- — inherits STATE
ZIP-level market 98371
- Rents YoY
- 1.4%
- Active inventory
- 227
- Price-to-rent
- 1.1×
Monthly cashflow live
- Estimated rent
- $2,201 high interval (Pro) →
- Mortgage (P&I)
- −$157
- Tax from tax record
- −$16 /mo · $195/yr
- Insurance
- −$12
- Flood insurance flood zone
- −$427 /mo · $5,118/yr
- HOA
- −$0
- Vacancy / Maint / Mgmt
- −$462
- Net cashflow
- $1,127
Break-even live
UW: 25.0% down · 7.5% · 30yr · 1.5% tax · 5.0% vac · 8.0% maint · 8.0% mgmt
Financing live
Cash to close
- Down payment
- $7,488
- Closing costs
- $898
- Reserves months
- —
- Total cash needed
- —
Loan-product check · same deal, 3 products live
Conventional
25% down · 7.5% · 30yr
- Down + closing
- —
- Monthly P&I
- —
- Monthly cashflow
- —
- DSCR
- —
- Eligible?
- —
Personal DTI + credit; lowest rate.
DSCR
20% down · 8.5% · 30yr
- Down + closing
- —
- Monthly P&I
- —
- Monthly cashflow
- —
- DSCR
- —
- Eligible?
- —
No personal income docs; deal must DSCR.
Hard money
10% down · 12.0% · 12mo
- Down + closing
- —
- Monthly P&I
- —
- Monthly cashflow
- —
- DSCR
- —
- Eligible?
- —
Short-term bridge; refi at stabilization.
Rent comps 9 comps
| Address | Beds | Baths | Sqft | Rent | $/sqft | DOM | Units | Dist |
|---|---|---|---|---|---|---|---|---|
| 8009 50th St E Fife, WA | 2.0 | 1.0 | 1100 | $2,150 | $1.95 | 17d | 1 | 0.83mi |
| 3351 70th Ave E Fife, WA | 1.0–3.0 | 1.0–2.0 | 950 | $2,599 | $2.74 | 1d | 12 | 0.94mi |
| 2629 Meridian Ave E Edgewood, WA | 1.0–2.0 | 1.0–2.0 | 801 | $2,165 | $2.70 | 4d | 8 | 1.25mi |
| 1503 18th St NW Puyallup, WA | 1.0–2.0 | 1.0 | 840 | $1,730 | $2.06 | 10d | 4 | 1.28mi |
| 200 Milton Way Milton, WA | 2.0 | 1.0 | 975 | $1,895 | $1.94 | 24d | 1 | 1.29mi |
| 10416 29th St E Unit 10416 Edgewood, WA | 2.0 | 1.0 | 900 | $1,675 | $1.86 | 43d | 1 | 1.33mi |
| 10426 29th St E Unit 10426 Edgewood, WA | 2.0 | 1.0 | 900 | $1,675 | $1.86 | 14d | 1 | 1.34mi |
| 2506 103rd Ave E Edgewood, WA | 2.0–3.0 | 1.0–1.5 | 1100 | $2,200 | $2.00 | 43d | 3 | 1.37mi |
| 2211 6th Ave Milton, WA | 1.0–2.0 | 1.0–1.5 | 836 | $1,985 | $2.37 | 1d | 5 | 1.40mi |
Listing history 15 events
-
2026-06-18days on market $29,950 Active 126 DOM
-
2026-06-17days on market $29,950 Active 125 DOM
-
2026-06-16days on market $29,950 Active 124 DOM
-
2026-06-15days on market $29,950 Active 123 DOM
-
2026-06-13days on market $29,950 Active 121 DOM
-
2026-06-13days on market $29,950 Active 120 DOM
-
2026-06-09days on market $29,950 Active 117 DOM
-
2026-06-08days on market $29,950 Active 116 DOM
-
2026-06-07days on market $29,950 Active 115 DOM
-
2026-06-04days on market $29,950 Active 112 DOM
-
2026-06-03days on market $29,950 Active 111 DOM
-
2026-06-02days on market $29,950 Active 110 DOM
-
2026-06-01days on market $29,950 Active 109 DOM
-
2026-05-31days on market $29,950 Active 108 DOM
-
2026-02-12$29,950 Active
ⓘ Source: listings_history table (triggers on properties + properties_extension) + one-shot
backfill from property_details.listing_events for pre-trigger history.
Tax reassessment forecast WA · Resets to sale price
- Current annual tax
- $195 · $16/mo
- Projected year-2 tax
- $294 · $24/mo
- Expected delta
- +$98/yr (+$8/mo · 50.5%)
ⓘ Screening estimate from a state-policy table — verify with the county assessor before closing.
Climate risk First Street
- Flood 5/10 Major FEMA zone AE · 64% chance over 30 yrs
- Wildfire 1/10 Low
- Heat 3/10 Moderate 7 d/yr ≥89°F today · 15 d/yr by 30 yrs out
- Wind 1/10 Low
- Air quality 7/10 Severe 11 unhealthy d/yr today · 12 by 30 yrs out
Nearby sold comps map
Loading sold comps map…
Walkable amenities ~0.75 mi
Loading nearby amenities…
Taxation est. · year 1
- Rental income
- $26,416
- − Mortgage interest
- −$1,678
- − Property taxes
- −$195
- − Insurance
- −$5,268
- − Repairs & maintenance
- −$2,113
- − Management
- −$2,113
- − Depreciation
- −$871
- Taxable income
- $14,177
- Est. tax owed @ 24.0%
- −$3,402
- After-tax cash flow
- $10,118/yr
For passive investors: Depreciation is non-cash, so a rental often shows a tax loss while cash-flowing — sheltering income. Rental losses are passive: they offset passive income freely, and up to $25,000/yr can offset ordinary (W-2) income if you actively participate and your MAGI is under $100k (phasing out to $0 by $150k); unused losses carry forward. On sale, claimed depreciation is recaptured at up to 25%, and gains may owe capital-gains tax (a 1031 exchange can defer both). Figures are a year-1 estimate at your 24.0% rate — not tax advice; consult a CPA.
Schools (NCES district)
- District
- Puyallup School District
- NCES district ID
- 5306960
- Math proficiency
- 53% ▬ 0.00%
- Reading proficiency
- 66% ▬ 0.00%
- Median HH income
- $68,291
- Composite
- 54.01/100
- National rank
- #3006
- State rank
- #52 of 291 in WA
Livability — Edgewood
- Score
- 80/100
- State rank
- #95
- US rank
- #1861
Category grades
Schools grade is shown separately in the Schools card above.
Census & demographics
- Census place
- Edgewood, WA
- County
- Pierce County · 788,257 people
- City population
- 26,662
- Metro
- Seattle-Tacoma-Bellevue, WA
- Population (ZIP)
- 24,682
- Household income
- $97,242
- Rent vs Own
- Severe rent burden
- 507.0
Population outlook (Pierce County) Hauer SSP2
- Today (2025)
- 956,648 people
- By 2030
- 1,010,862 · +5.7%
- By 2040
- 1,113,170 · +16.4%
- By 2050
- 1,206,524 · +26.1%
- By 2075
- 1,436,425 · +50.2%
- By 2100
- 1,563,654 · +63.5%
Race, ethnicity, and origin ACS 2023
- Neighborhood character
- Predominantly White (70%)
- Race & ethnicity
- White 70% Two or more races 12% Hispanic / Latino 11% Asian 6% Black 4%
- Hispanic origin (detail)
- Mexican 9%
- Common ancestry
- Portuguese 5% Slovak 3% Italian 2%
- Foreign-born
- 10% · Canada, South Korea, Vietnam
- Languages at home
- 85% English-only · Spanish 5% Korean 2% Vietnamese 2%
Political lean MEDSL · Pierce
- 2024 margin
- D (+10.8) · D 53.9% · R 43.1% · Other 3.0%
- 2008→2024 swing
- -1.4pp toward R · 2008: 12.2pp · 2024: 10.8pp
- All cycles
- 2024: D+10.8 2020: D+11.2 2016: D+7.5 2012: D+11.0 2008: D+12.2
Not yet ingested
- Civics
- —
Market trends
- HPI YoY
- ▼ -580.45%
- Current HPI
- 295.2143
- Rent YoY
- ▲ 1.41%
- Metro
- Seattle-Tacoma-Bellevue, WA
- State GDP YoY
- ▲ 4.65%
- F500 in state
- 22
Industry mix (Fortune 500 HQ in WA)
| Industry | F500 HQs | Revenue |
|---|---|---|
| Retail | 2 | $269B |
|
||
| Technology / Retail | 1 | $638B |
|
||
| Technology | 1 | $245B |
|
||
| Telecommunications | 1 | $38B |
|
||
| Food / Beverage | 1 | $36B |
|
||
| Automotive / Trucks | 1 | $34B |
|
||
Price history
1 event — show timeline
- 2026-02-12 Listed $29,950 NWMLS as Distributed by MLS Grid
Property tax history
+8.5%/yrLatest (2026): $195 · +0.1% YoY. Source: county tax records.
Cash-flow waterfall
monthlySold comps — $/sqft
last 12 mo · ≤1 miLoading sold comps…