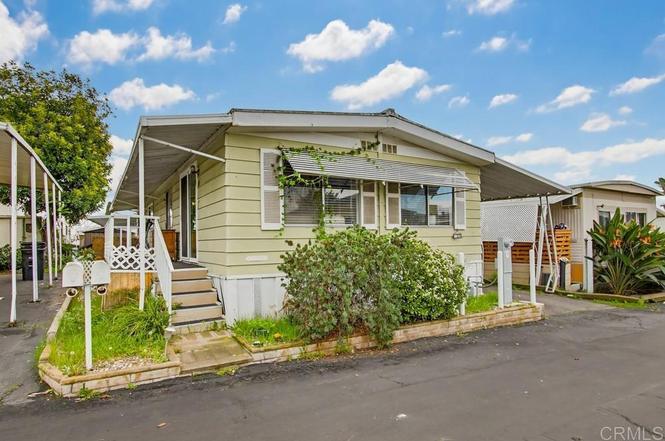
351 E Bradley Ave Spc 52
Bostonia, CA 92021
$134,900B
2 bd · 2.0 ba ·
1,040 sqft ·
Built 1978
· Manufactured
· Active
· 160 DOM
Cashflow @ list (25.0% down · 7.5%)
Estimated rent
$2,421/mo
Mortgage (P&I)
−$707
Tax + insurance
−$225
HOA
−$0
Vac / Maint / Mgmt
−$508
Net cashflow
$980/mo
Annual
$11,764/yr
Cap rate
15.01%
Cash-on-cash
31.14%
DSCR
2.39
1% rule
1.79%
Cash to close
$37,772
Investor read
- This is a 2-bed/2.0-bath manufactured listed at $135k.
- At list price, monthly cash flow is $980 ($12k/yr) — positive.
- The deal already cash-flows at list — no discount required.
- Meets the 1% rule at list price ($2k rent vs $135k).
- It's been on market 160 days — a 12% lower offer ($119k) is reasonable based on typical stale-listing flexibility.
- Recommended offer: $119k (12.0% below list) — sets the bar for market timing.
- Local home prices are declining (-3.0%/yr); year-one equity from $933 of loan paydown is wiped out by about $4k of value loss. Plan a longer hold.
- Location reads 65/100 on livability (#383 in CA) — a middle-class / working-renter tenant base. Strengths: commute A+, housing B+; Watch: schools D, crime F, amenities F.
- Grossmont Union High (suburban): math 31% / reading 60% proficiency, ranked #173 of 517 in CA (top 34%) — families likely to look elsewhere, expect single-tenant / working-renter base with shorter leases; only 17% free/reduced lunch — higher-income household profile.
- Market conditions: Rents soft (-0.8%/yr); 238 active listings in the ZIP; 40 comparable units currently listed for rent nearby; rentals leasing fast (median 2d on market — plan ~1-2 weeks tenant-placement turnaround); 11,759 units permitted in San Diego County in 2024 (7,244 in 5+ unit buildings).
- San Diego County population projected at +20% by 2050 — long-run rental-demand tailwind backs the buy-and-hold thesis.
- At projected returns (-3.0% appreciation + 0.0% rent growth), your $38k cash investment doubles in ~5 years — after that, you're playing with house money.
- Climate carrying-cost: extreme-heat days projected 5→14/yr by 2055 (HVAC capex compounding) — expect insurance premiums to compound above CPI over the hold.
- Cap rate 15.0% vs local median 6.0% in Bostonia — top-decile yield for the area; either an underpriced asset or a hidden risk that comps aren't pricing in. Stress-test before assuming the spread holds.
- This rent runs 39% of the median local income ($74k/yr) — at the standard rent-burdened threshold; future hikes will face affordability resistance.
Questions for listing agent
- It's been on market 160 days. Have you received any prior offers? Is the seller open to a 12% concession, seller financing, or rate buy-down credit?
- Built in 1978 — when were the roof, HVAC, electrical panel, plumbing, and water heater last replaced?
- Why hasn't it sold? Are there any deal-killer items the seller is aware of (foundation, flood, title, zoning, code violations)?
- Is there a deadline driving the sale (1031 exchange, divorce, estate, relocation)? That informs how much negotiation room exists.
- Schools are D-rated, which usually means shorter tenancies and higher turnover. Who's the typical renter profile here, and what's been the actual vacancy rate?
- Crime grade is F in this area — have there been break-ins, vandalism, or insurance claims at this property in the last 3 years? What carrier currently insures it and at what premium?
- What's the average days-on-market for RENTAL listings here right now (not sales)? A rising rental-DOM trend means longer vacancies and softer asking-rent achievability than the comps imply.
- What's the recent tenant-quality profile in this submarket — average credit score on applications, eviction rate, late-payment / NSF rate, and stable-employment percentage? A property-management company in the area should have these aggregated.
CashFlowRE · CFR-PF3EWCC26PS0E3
· Data 2 days ago
cashflowre.app · 2026-05-29